Blog
Mastering Forex Analysis: Fundamental vs. Technical Analysis
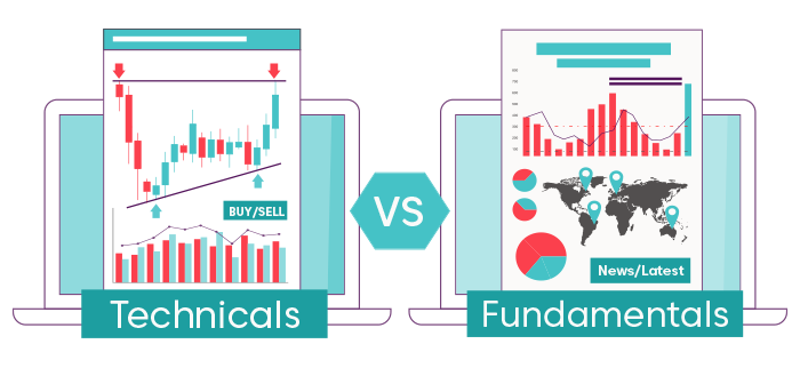
When it comes to stock picking, there are two main schools of thought: fundamental analysis and technical analysis. Fundamental analysts evaluate a company's financial health and growth potential. They do this by analyzing financial documents, such as the income statement and balance sheet. However, technical analysts concentrate on price and volume data to find patterns and trends that can predict future price changes.
While both fundamental and technical analysis have their merits, each approach is better suited to different types of traders and investors. In this article, we'll explore the key differences between fundamental and technical analysis. Also we will examine how each approach can be used to inform short-term and long-term trading strategies.
Fundamental Analysis
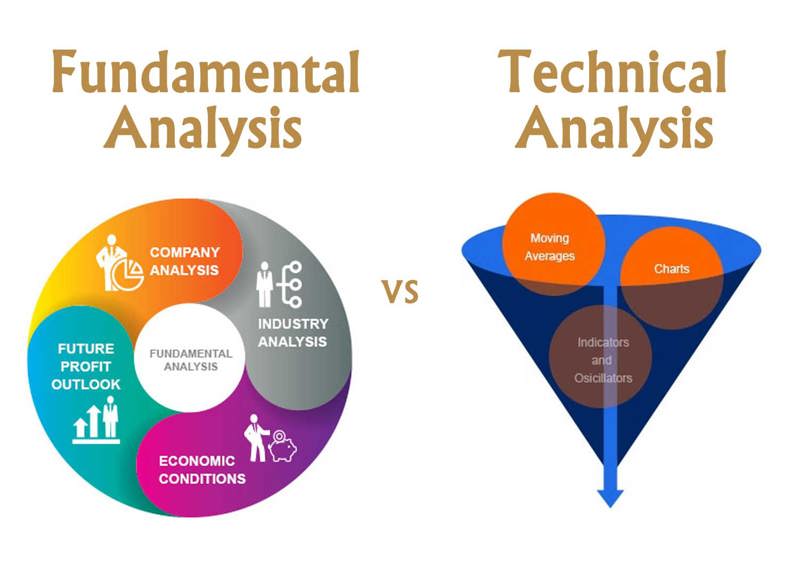
Fundamental analysis refers to the process of evaluating a company's financial statements. It also includes other relevant data to determine its intrinsic value and potential for future growth. This approach takes a long-term view, focusing on factors such as earnings per share, revenue growth, and profit margins. This helps to determine a company's overall financial health and potential for future success.
Fundamental analysts use financial statements and other data to make informed predictions about a company's future price movement. They may also consider broader economic factors, such as interest rates and GDP growth, to inform their investment decisions. This approach is best suited to long-term investments. Since it can take time for a company's financial health to be reflected in its stock price.
Technical Analysis
Technical analysis is a methodology used by traders to analyze financial markets. In order to make trading decisions based on price and volume data. It revolves around the idea that historical price patterns and trends can provide insights into future price movements.
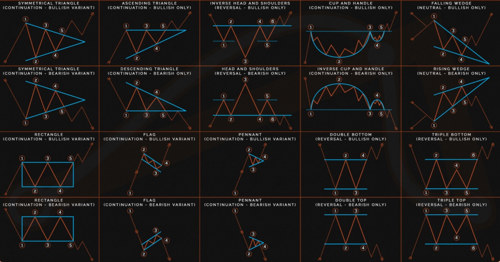
One of the primary tools used in technical analysis is charting. Traders often examine price charts to visually identify patterns, such as support and resistance levels, trendlines, and chart formations like triangles or head and shoulders patterns. These patterns can indicate potential buying or selling opportunities. By recognizing recurring patterns, traders aim to predict future price movements and time their trades accordingly.
Moving averages are another commonly used tool in technical analysis. They help smooth out price data and reveal underlying trends. By calculating the average price over a specified period, such as 50 or 200 days, traders can determine the direction and strength of a trend. Crossovers between different moving averages can also signal potential buying or selling opportunities.
Price action analysis is another integral aspect of technical analysis. It involves studying the behavior of price itself, rather than relying solely on indicators. Traders observe how prices react at specific levels or in response to certain events, such as breakouts or reversals. This analysis helps traders gauge market sentiment and make informed decisions.
Technical analysts use various time frames to evaluate price data. Short-term traders often focus on intraday or hourly charts, seeking quick profits from short-lived price movements. On the other hand, longer-term traders may rely on daily, weekly, or monthly charts to capture broader trends and hold positions for extended periods.
Support and resistance levels play a crucial role in technical analysis. Support represents a price level at which buying pressure is expected to prevent prices from falling further, while resistance is a level where selling pressure is expected to halt upward price movement. Traders often use these levels to set entry and exit points for their trades.
Other indicators, such as oscillators (e.g., Relative Strength Index or Stochastic Oscillator), volume analysis, and Fibonacci retracements, are also employed by technical analysts to confirm signals or identify potential reversals.
While technical analysis is best suited for short-term trading due to its focus on patterns and trends that can be exploited for quick trading decisions, it can also be used in conjunction with fundamental analysis for a more comprehensive approach. By combining both methods, traders can gain a more well-rounded understanding of the market and increase their chances of success.
It is important to note that technical analysis has its limitations. It relies on historical data and patterns, which may not always accurately predict future price movements. External factors such as news events, economic data, or geopolitical developments can quickly override technical signals. Therefore, it is essential for traders to stay updated on relevant news and market conditions while employing technical analysis techniques.
Fundamental and Technical Analysis Combined
Fundamental and technical analysis, although often seen as distinct methodologies, can be effectively combined to create a more comprehensive and informed trading strategy. By integrating both approaches, traders gain a broader understanding of a company's financial health, growth potential, and the current trends and patterns in its stock price.
Fundamental analysis focuses on evaluating a company's financial statements, examining factors such as earnings per share, revenue growth, profit margins, and other relevant data. This analysis provides insights into the company's intrinsic value and long-term prospects. By utilizing fundamental analysis, traders can identify promising companies with strong financials and growth potential.
Once a promising company is identified through fundamental analysis, technical analysis can be employed to evaluate the company's stock price and identify potential trading opportunities. Technical analysis involves studying price and volume data, analyzing charts, patterns, and indicators to predict future price movements. By utilizing tools such as moving averages, chart patterns, and oscillators, traders can identify entry and exit points based on short-term trends and patterns.
For instance, a trader might use fundamental analysis to identify a company with solid financials, strong management, and a competitive edge in its industry. They might analyze the company's revenue growth, profit margins, and market share to gauge its long-term growth potential. Once satisfied with the fundamental analysis, the trader can then turn to technical analysis to assess the company's stock price. They can examine charts, identify support and resistance levels, and analyze indicators to identify potential entry points for a trade.
By combining fundamental and technical analysis, traders can develop a more comprehensive and well-rounded trading strategy. This approach takes into account both the long-term prospects of a company and the short-term trends and patterns in its stock price. It provides a more holistic view of the market, allowing traders to make informed decisions based on a combination of fundamental factors and technical signals.
In conclusion, both fundamental and technical analysis have their place in stock picking and forex trading. Fundamental analysis is best suited for long-term investments, providing insights into a company's financial health and growth potential. On the other hand, technical analysis is more suitable for short-term trading, identifying short-term trends and patterns. By integrating both approaches, traders can develop a more robust trading strategy that considers both the fundamental aspects of a company and the current market dynamics.