Blog
Learn How Ichimoku Cloud Patterns Work
Hello, dear followers of Arya Trader. In this tutorial we will be talking about one of the most important types of charts used in technical analysis to display support and resistance, momentum, and trend in one view. In technical analysis, these patterns signal the transitions in the trends.
From beginners to professionals, chart patterns play an integral part when looking for market trends and predicting movements. They can be used to analyze all markets, including forex, shares, commodities, etc.
In this part of the article, we will talk about what does ichimoku cloud mean?, components of this cloud, how this indicator works?, what does it tell you? its difference with moving averages and finally its limitations. So without losing any time, let’s start with the introduction.
What is the Ichimoku Cloud?
The Ichimoku Cloud is a collection of technical indicators that show support and resistance levels, as well as momentum and trend direction. It does this by taking multiple averages and plotting them on a chart. It also uses these figures to compute a “cloud” that attempts to forecast where the price may find support or resistance in the future.
The Ichimoku Cloud was developed by Goichi Hosoda, a Japanese journalist, and published in the late 1960s. It provides more data points than the standard candlestick chart. While it seems complicated at first glance, those familiar with how to read the charts often find it easy to understand with well-defined trading signals.
The Ichimoku Cloud is a type of chart used in technical analysis to display support and resistance, momentum, and trend in one view. TenkanSen and KijunSen are similar to moving averages and analyzed in relationship to one another.
When the shorter term indicator, TenkanSen, rises above the longer term indicator, KijunSen, the securities trend is typically positive. When TenkanSen falls below KijunSen, the securities trend is typically negative. TenkanSen and KijunSen as a group are then analyzed in relation to the Cloud, which is composed of the area between Senkou A and Senkou B.
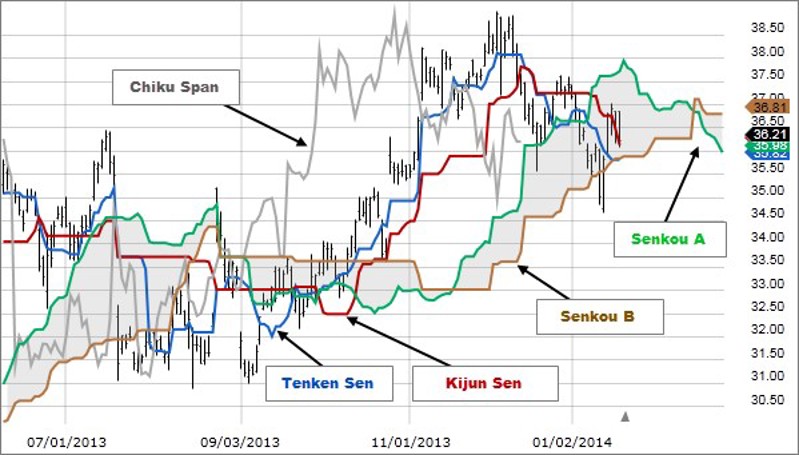
Here, we provide a brief breakdown of these four components:
- The Tenkan Sen (conversion line) is calculated by the sum of the highest high and the lowest low divided by two. The default setting is 9 periods.
- The Kijun Sen (standard or base line) is based on the same formula as the Tenkan Sen, but the default here is 26 periods.
- The Chikou Span (lagging span) represents the current closing price time shifted backwards 26 periods
- The Kumo (cloud) consists of two lines - the Senkou spans A and B. The former one is calculated by the adding Tenkan Sen and Kijun Sen and then divided by two, shifted forwards 26 periods. The latter represents the highest high + lowest low)/2 for the last 52 periods, also shifted 26 periods in the future.
How this indicator works
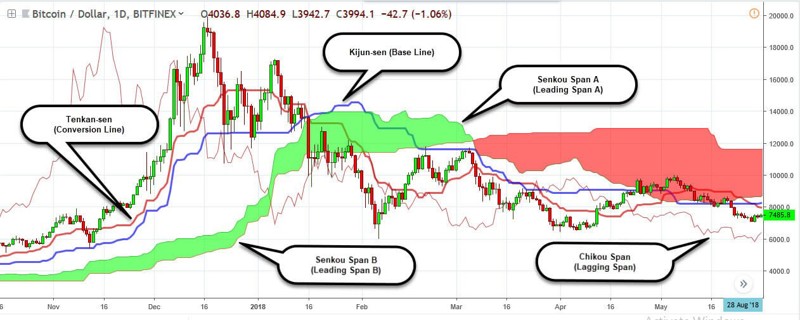
When TenkanSen and KijunSen are decidedly above the Cloud, the issue's trend is positive.
When TenkanSen and KijunSen are decidedly below the Cloud, the issue's trend is negative.
Using the Cloud to determine trend:
When prices are above the cloud, the trend is up. When prices are below the cloud, the trend is down.
When Sendou A is rising and above Senkou B, the uptrend is strengthening. When Senkou A is falling and below Senkou B, the downtrend is strengthening.
A buy signal is reinforced when the Tenkan Sen crosses above the Kijun Sen while the Tenkan Sen, Kijun Sen, and price are all above the cloud.
A sell signal is reinforced when the TenKan Sen crosses below the Kijun Sen while the Tenkan Sen, Kijun Sen, and price are all below the cloud.
What Does the Ichimoku Cloud Tell You?
The technical indicator shows relevant information at a glance by using averages. The overall trend is up when the price is above the cloud, down when the price is below the cloud, and trendless or transitioning when the price is in the cloud.
When Leading Span A is rising and above Leading Span B, this helps to confirm the uptrend and the space between the lines is typically colored green. When Leading Span A is falling and below Leading Span B, this helps confirm the downtrend. The space between the lines is typically colored red in this case.
Traders will often use the Ichimoku Cloud as an area of support and resistance depending on the relative location of the price. The cloud provides support/resistance levels that can be projected into the future. This sets the Ichimoku Cloud apart from many other technical indicators that only provide support and resistance levels for the current date and time.
Traders should use the Ichimoku Cloud in conjunction with other technical indicators to maximize their risk-adjusted returns. For example, the indicator is often paired with the relative strength index (RSI), which can be used to confirm momentum in a certain direction. It’s also important to look at the bigger trends to see how the smaller trends fit within them.
For example, during a very strong downtrend, the price may push into the cloud or slightly above it, temporarily, before falling again. Only focusing on the indicator would mean missing the bigger picture that the price was under strong longer-term selling pressure.
The Difference Between the Ichimoku Cloud and Moving Averages
While the Ichimoku Cloud uses averages, they are different than a typical moving average. Simple moving averages take closing prices, add them up, and divide that total by how many closing prices there are. In a 10-period moving average, the closing prices for the last 10 periods are added, then divided by 10 to get the average.
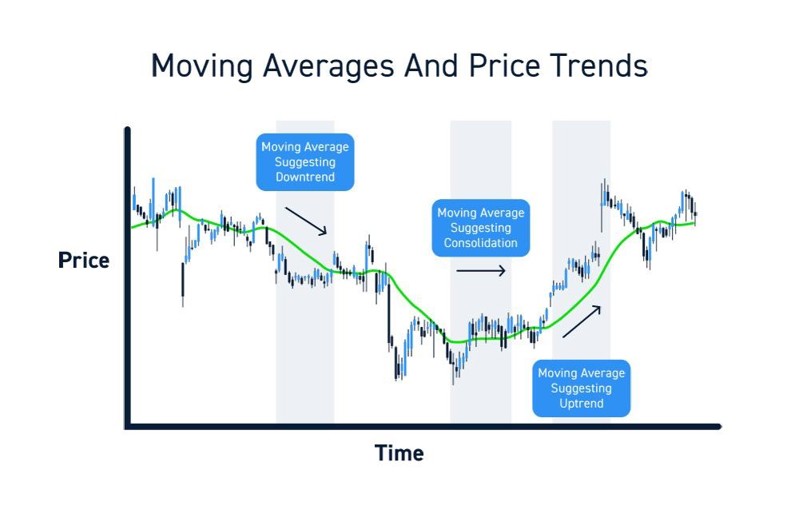
Notice how the calculations for the Ichimoku Cloud are different. They are based on highs and lows over a period and then divided by two. Therefore, Ichimoku averages will be different than traditional moving averages, even if the same number of periods are used. One indicator is not better than another; they just provide information in different ways.
Limitations of Using the Ichimoku Cloud
The indicator can make a chart look busy with all the lines. To remedy this, most charting software allows certain lines to be hidden. For example, all of the lines can be hidden except for Leading Span A and Leading Span B, which create the cloud. Each trader needs to focus on which lines provide the most information, then consider hiding the rest if all of the lines are distracting.
Another limitation of the Ichimoku Cloud is that it is based on historical data. While two of these data points are plotted in the future, there is nothing in the formula that is inherently predictive. Averages are simply being plotted in the future.
The cloud can also become irrelevant for long periods of time, as the price remains way above or way below it. At times like these, the conversion line, the base line, and their crossovers become more important, as they generally stick closer to the price.
Watch our video for detailed explanation!