Blog
Harmonic Price Patterns
Hello dear followers of Arya Trader. Today, we will be talking about harmonic price patterns and its usage in financial markets.
The concept of Harmonic Patterns was established by H.M. Gartley in 1932. Gartley wrote about a 5-point pattern (known as Gartley) in his book Profits in the Stock Market. Larry Pesavento has improved this pattern with Fibonacci ratios and established rules on how to trade the “Gartley” pattern in his book Fibonacci Ratios with Pattern Recognition.
There are few other authors who have worked on this pattern theory, but the best work to my knowledge is done by Scott Carney in his books of “Harmonic Trading.” Scott Carney also invented patterns like “Crab,” “Bat,” “Shark” and “5-0” and added real depth of knowledge for their trading rules, validity and risk/money management.
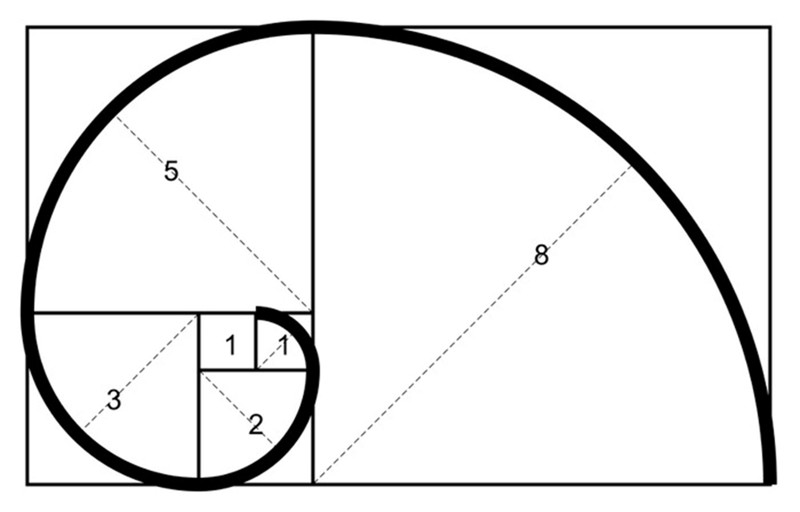
The primary theory behind harmonic patterns is based on price/time movements which adhere to Fibonacci ratio relationships and its symmetry in markets. Fibonacci ratio analysis works well with any market and on any timeframe chart.
The basic idea of using these ratios is to identify key turning points, retracements and extensions along with a series of the swing high and the swing low points. The derived projections and retracements using these swing points (Highs and Lows) will give key price levels for Targets or Stops.
Harmonic patterns construct geometric pattern structures (retracement and projection swings/legs) using Fibonacci sequences. These harmonic structures identified as specified (harmonic) patterns provide unique opportunities for traders, such as potential price movements and key turning or trend reversal points.
This factor adds an edge for traders as harmonic patterns attempt to provide highly trustworthy information on price entries, stops and targets information. This may be a key differentiation with other indicators/oscillators and how they work.
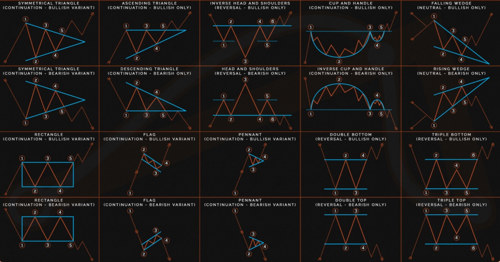
What do these patterns look like?
In general, all harmonic patterns are based from 5 turning points in price.
However, each type of harmonic pattern has a different geometrical shape and Fibonacci ratio. We name these points X, A, B, C and D. Each harmonic patterns follows its own set of rules that will discuss in greater detail later in this article.
Why are these patterns important?
The main importance of harmonic patterns is to predict price movements.
By finding patterns of different magnitudes and lengths and applying Fibonacci coefficients to them, day traders can try to forecast the future movement of financial instruments like stocks, options, and more.
Harmonic patterns are the key to identifying reversals. They are a very precise instrument, characterizing very specific price movements.
Types of Harmonic Patterns
Although there are many types of harmonic patterns, only a few have stood the test of time because they form more frequently on the price charts. In this section, we will go through each one and outline their differences.
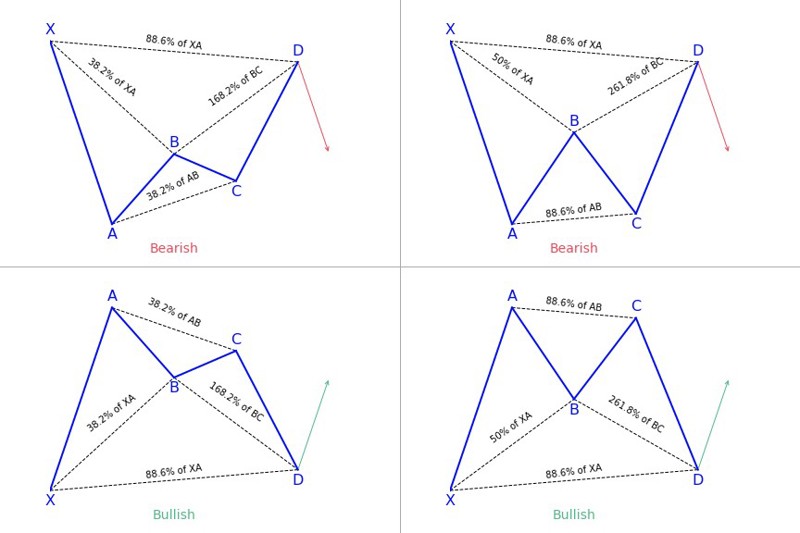
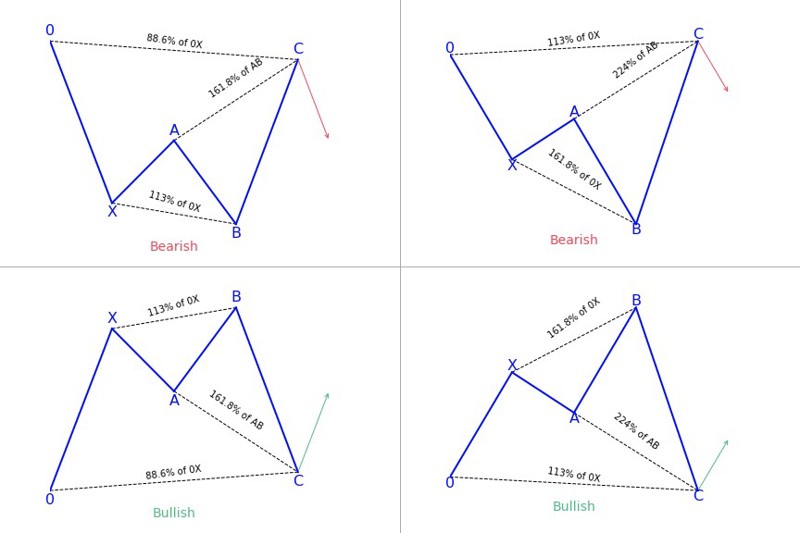
The Butterfly Pattern
The butterfly pattern is a reversal pattern that is often found at the end of a trend move. It was introduced by Bryce Gilmore and is made up of five points: X, A, B, C, and D.
Here's a diagram of the butterfly pattern.
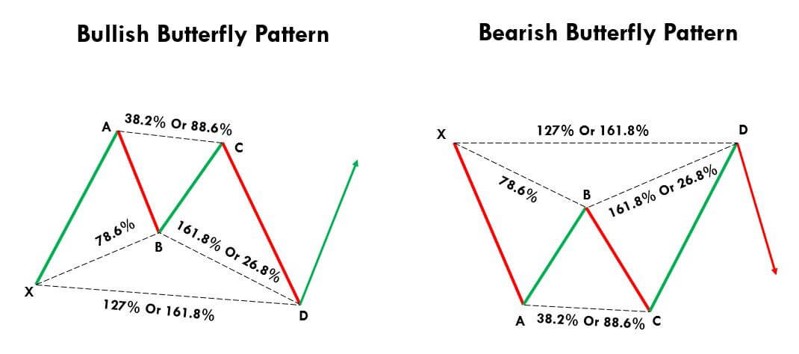
The pattern can form two formations: The bullish butterfly, which indicates when traders should buy, and the bearish butterfly, indicating when traders ought to sell.
Butterfly patterns help traders in spotting the end of the current move so that they can take the trade.
The Gartley Pattern
The Gartley pattern is a simple harmonic pattern that is preceded by a significant low or high. As mentioned earlier, this pattern was developed by Harold McKinley Gartley. It is also known as the ‘222’ pattern based on the page number it is outlined in his book, Profits in the Stock Market.
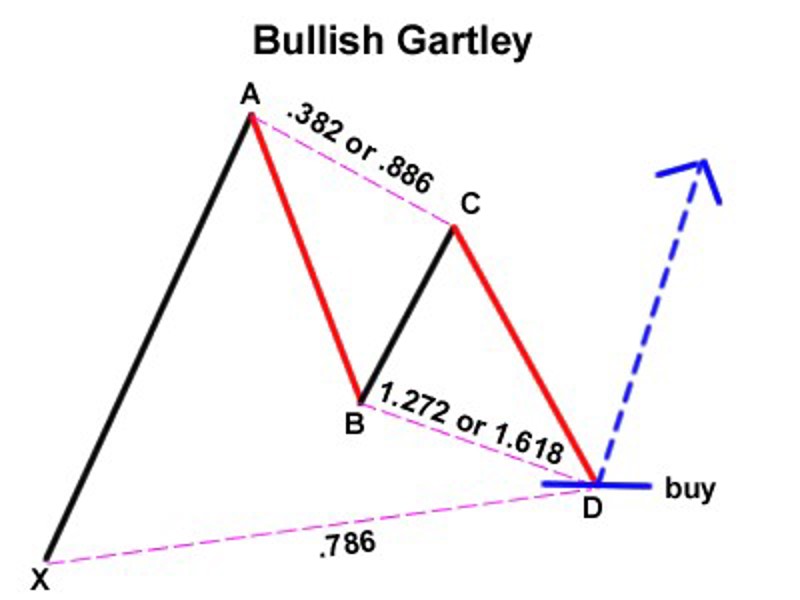
Gartley patterns usually form when a correction of the overall trend is taking place. Bearish Gartley patterns look like ‘M’ while bearish patterns W-shaped.
The Bat Pattern
The Bat pattern was discovered by Scott Carney in the early 2000s. Like the Gartley pattern, the Bat pattern is a retracement and continuation pattern that forms when a trend temporarily reverses its direction but then continues on its original course.
This pattern allows traders to enter a trend at a good price just as it is resuming.
The Crab Pattern
This pattern was also developed by Scott Carney, who claims it’s the most effective harmonic patterns to use when trading. It is a reversal pattern consisting of four legs marked X-A, A-B, B-C and C-D.
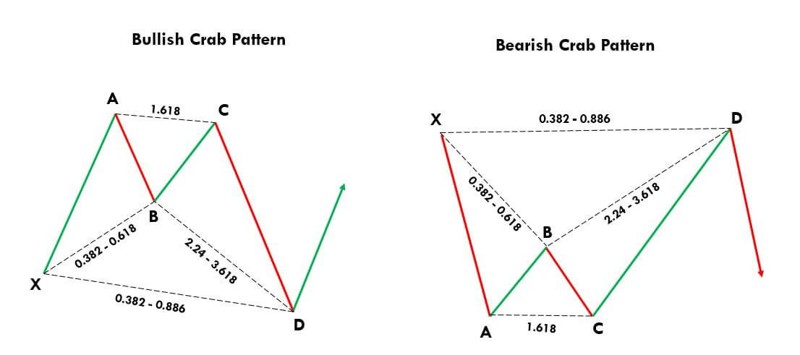
According to Carney, one main advantage of using the Crab pattern instead of other types of harmonic patterns is, the high risk/reward ratio because these set ups allow you to have very tight stop losses.
It allows traders to enter the market at extreme lows or highs.
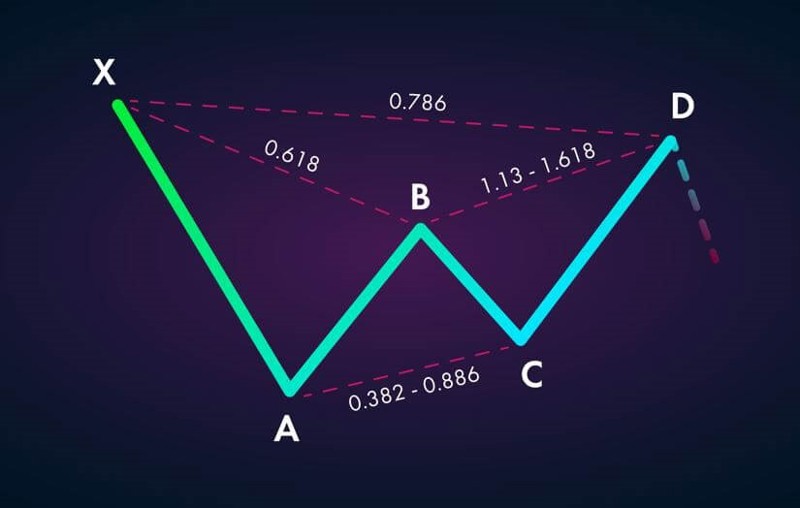
The Cypher Pattern
The cypher pattern has five touchpoints and four waves or legs between them. Every touchpoint represents reversal levels, while each leg highlights a price action.
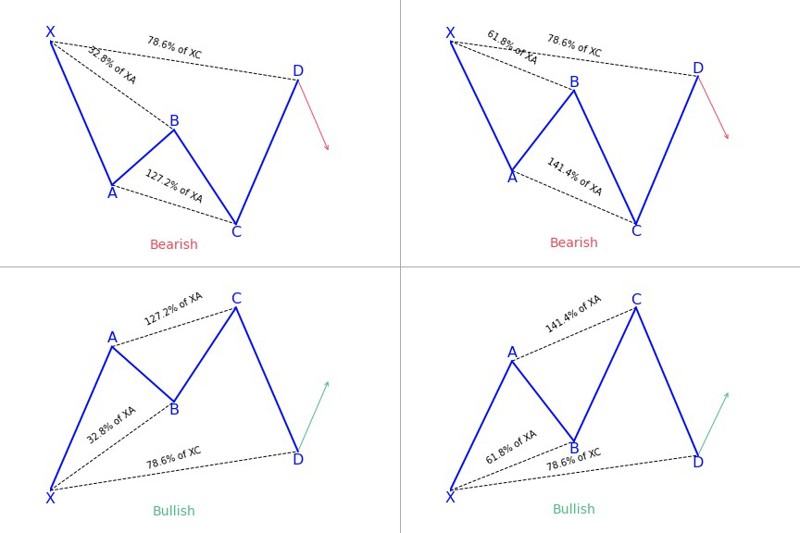
It uses tighter Fibonacci ratios (usually less than 1), thus creating a steeper visual appearance..
The Shark Pattern
The shark pattern is another type of harmonic pattern. It is one of the newer harmonic trading patterns and traders have been using since 2011.
The pattern got its name because its steep outside lines and shallow dip in the middle form a chart that looks like a dorsal fin.
As a result, in this article, we rewired one of the most used harmonic price patterns. Those patterns can be applied to most financial markets, which could be a good way to start your technical analysis. By learning about these chart patterns, you will be able to learn how to profit from these technical price patterns. For more information, please do not forget to visit Aryatrader.com and follow our other social media accounts to discover the benefits of artificial intelligence in your transactions. Thanks for watching. See you in the next article.