Blog
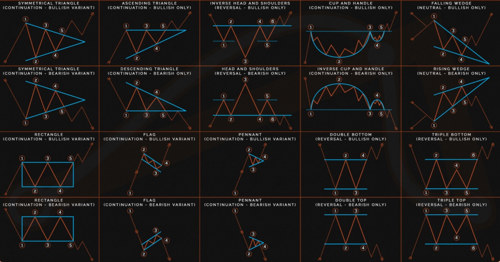
Examples of Chart Patterns: Bearish Candlestick Patterns
Hello, dear followers of Arya Trader. In the previous tutorial, we discussed one of the most important trading tools that you can utilize as a part of your technical analysis strategy. Candlestick Chart patterns have a crucial role when analyzing charts for trading. In technical analysis, these chart patterns signal the transitions in the trends. From beginners to professionals, chart patterns play an integral part when looking for market trends and predicting movements. They can be used to analyze all markets, including forex, shares, commodities, etc.
In the second part of this series, we talked about examples of candlestick patterns, namely, bullish candlestick patterns. We rewired the most well-known and used bullish patterns, including the hammer, piercing, the morning star, and more.
In this part of the article, we will talk about the bearish candlestick chart patterns. you will be able to learn more information about what those patterns mean? how to use those patterns? and its examples include shooting star, hanging man, bearish engulfing crack, evening star, dark cloud cover, and three black crows.
Without losing any time, let’s start with the introduction.
What is a bearish candlestick chart pattern?
Bearish candlestick patterns consist of a single or a combination of candlesticks that usually indicate lower price movements in a stock. They typically show investors where the bulls are giving up and bears are taking over. Many of these are reversal patterns.
How to use bearish candlestick patterns?
Combining bearish candlestick patterns with a price action trading strategy is the best way to use candlestick patterns. If you are working on the price action strategies like reversals or pullbacks, it would be a rational decision to learn bearish candlestick patterns to be able to predict future price movements.
Clearly, the prediction for a bearish candlestick pattern goes to the downside. Therefore, it would help you to understand how to short-sell or use these bearish strategies to know when to take profits or expect pullbacks in your long positions.
Using Bearish Candlestick patterns to buy/sell stocks
Usually, bearish candlestick patterns are used for selling stocks. The main motivation behind this tendency is that they give investors a very definable area of risk with a set reward. This is a simple way to manage risk while you allow the candlestick pattern to play out. It can also give you a potential target for your entry.
Using bearish candlestick patterns as a signal to buy/sell signals is another efficient way of using those patterns. That is, if you have been long in a position and you see a bearish candlestick pattern, you might know that it is now time for a reversal. This can give you confidence in some of your profits before reversal.
There are important notes before examining the most powerful bearish candlestick patterns:
● Bearish reversal patterns should form at the end of an uptrend otherwise, it will act just like a continuation pattern.
● One should confirm the reversal signals given by bearish reversal patterns with other indicators such as volume and resistance.
Although there are vast numbers of bearish chart patterns, we selected a narrow field by selecting a few of the most popular patterns for detailed explanations.
Let’s start with the first one: The shooting star
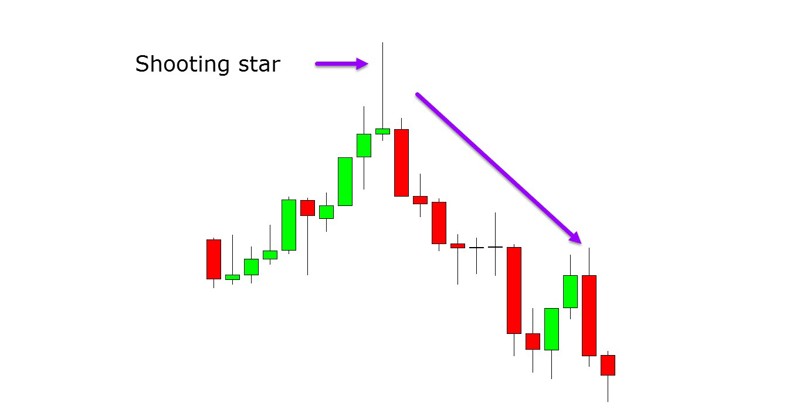
A shooting star is a bearish candlestick with a long upper shadow, little or no lower shadow, and a small real body near the low of the day. It appears after an uptrend. A shooting star is a type of candlestick that forms when security opens, advances significantly, but then closes the day near the open again.
The formation must appear during a price advance for a candlestick to be considered a shooting star. Also, the distance between the highest price of the day and the opening price must be more than twice as large as the shooting star’s body. There should be little to no shadow below the real body.
Shooting stars indicate a potential price top and reversal. The shooting star candle is most effective when it forms after a series of three or more consecutive rising candles with higher highs. It may also occur during a period of overall rising prices, even if a few recent candles were bearish.
Before trading with the shooting star, one should remember the following points:
- Trade Entry: Before you enter a shooting star trade, you should confirm that the prior trend is an active bullish trend.
- Stop Loss: You should always try to use a stop-loss order when trading the shooting star candle pattern.
- Taking Profits: The price target for this trade should be equal to the size of the shooting star pattern.
The Hanging Man Pattern
The Hanging Man Pattern visually looks similar to the Hammer pattern. However, while the hammer is usually bullish at the end of a downtrend, Hanging Man is a bearish candlestick pattern at the end of an uptrend.
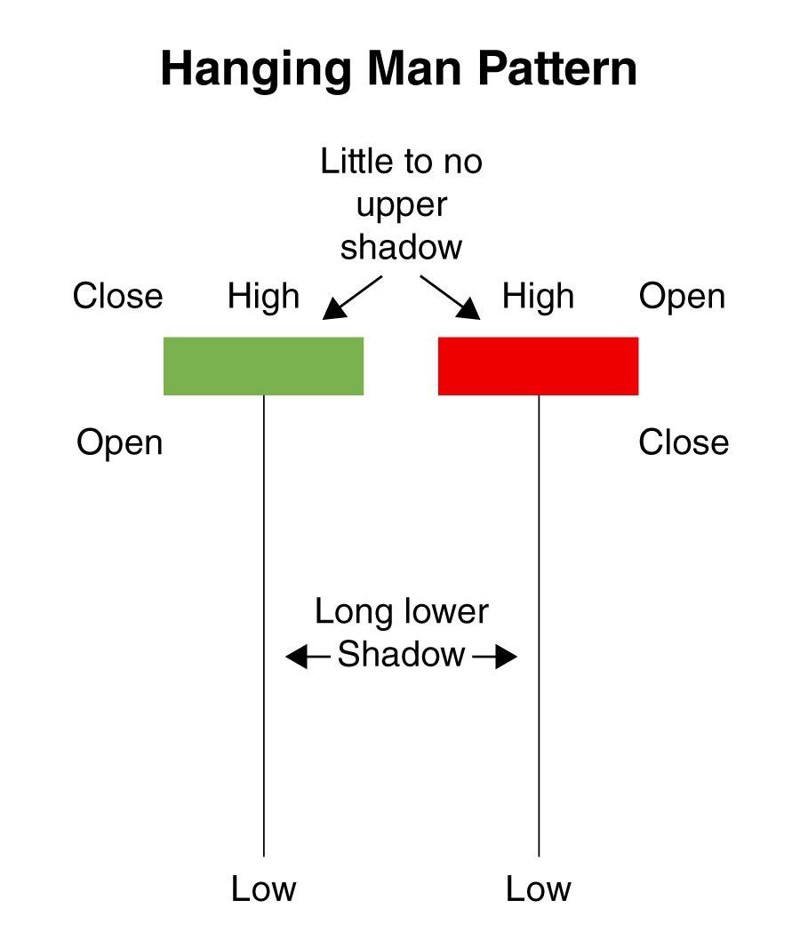
To recognize this pattern, selling pressure is the key factor. Inside the formation of the candle, there is considerable selling pressure to begin with. The close at the highs can be misleading in that the selling pressure is mostly overcome as it rallies. Oftentimes this results in an opportunity to trap longs who may believe the supply was overcome by demand. However, the supply is still present. If longs who bought on the way back up are overcome on the next candle, they are likely trapped from their entries and will add to the selling pressure as the stock capitulates.
Usually, there is no shadow or just a very small shadow towards the top. This pattern shows when increased demand has pushed up the asset price, but selling was excessive, and the price began to fall. In some cases, the hanging man also appears in the midst of a general uptrend, and the upside may remain strong going forward.
For the entry, the next candle after the close of the Hanging Man would provide the nearest risk/reward entry at the top.
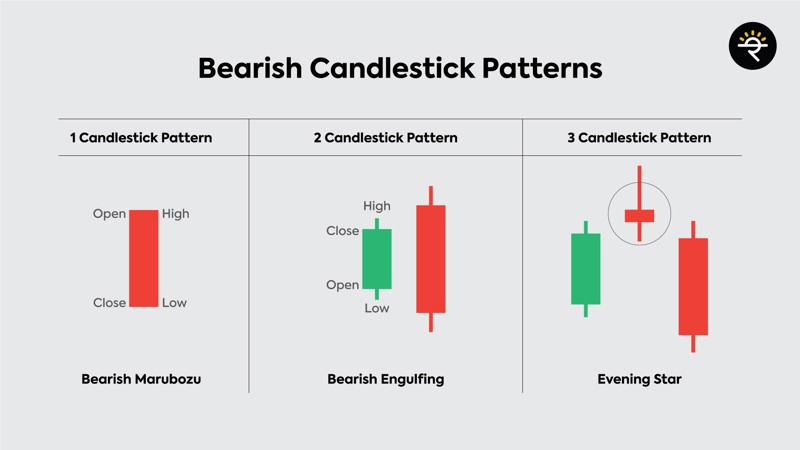
Bearish Engulfing Crack
The bearish engulfing pattern consists of two candlesticks: the first is white, and the second is black. The size of the white candlestick is relatively unimportant, but it should not be a Doji, which would be relatively easy to engulf. The second should be a long black candlestick. The bigger it is, the more bearish the reversal. The black body must totally engulf the body of the first white candle. Ideally, the black body should also engulf the shadows, but this is not a requirement. Shadows are permitted, but they are usually small or nonexistent or both candlesticks.
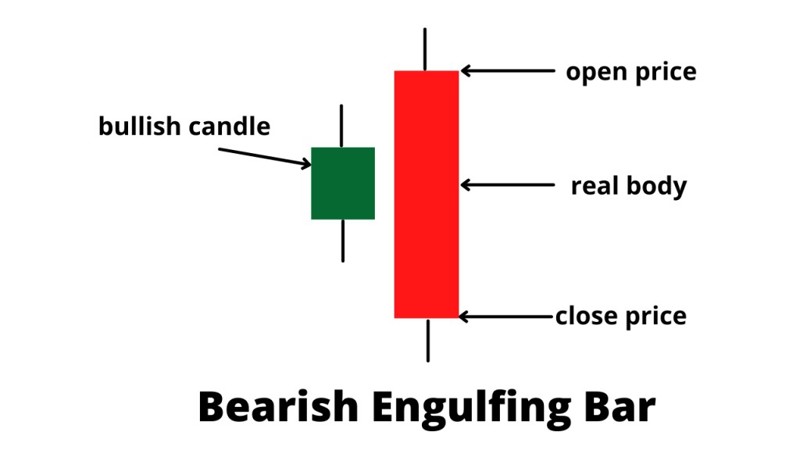
After an advance, the second black candlestick begins to form when residual buying pressure causes the security to open above the previous close. However, sellers step in after this opening gap up and begin to drive prices down. By the end of the session, selling becomes so intense that prices move below the previous open. The resulting candlestick engulfs the previous day's body and creates a potential short-term reversal. Further weakness is required for bearish confirmation of this reversal pattern.
Entry:
There can be few entries on this pattern depending on experience. Aggressive traders may enter as the candle forms if the supply is clearly visible. This is more of an anticipatory entry.
If trading by the book, you may want to wait until the new low is confirmed, then enter on the next candle. Ideally, you want to trade in either the direction of the larger trend or enter as an overextended trend reversal. Set your stop in the body of the candle or at the high of the candle, depending on its range.
The Evening Star
The evening star consists of three candlesticks:
- A long white candlestick.
- A small white or black candlestick that gaps above the close (body) of the previous candlestick. This candlestick can also be a Doji, in which case the pattern would be an evening Doji star.
- A long black candlestick.
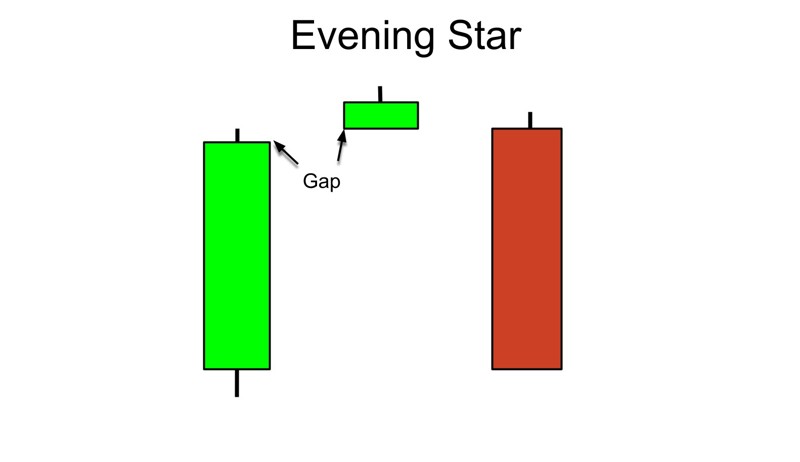
The long white candlestick confirms that buying pressure remains strong and the trend is up. when the second candlestick gaps up, it provides further evidence of residual buying pressure. However, the advance ceases or flows significantly after the gap, and a small candlestick forms, indicating indecision and a possible reversal of the trend. If the small candlestick is a Doji, the chances of a reversal increase. The third long black candlestick provides bearish confirmation of the reversal.
As the Evening Star indicates that the uptrend is going to end, its appearance is a red flag to traders and gives a sign that it is time to book profits.
Dark Cloud Cover
Dark Cloud Cover is the opposite of a bullish reversal pattern called the Piercing Line. The bearish pattern must first have a solid green or white bar continuing the uptrend.
After the bullish candle closes, we expect to see another candle try to make new highs. This new candle fails, then closes more than midway into the body of the 1st candle. Hence, the overhead supply is called “dark cloud cover.”
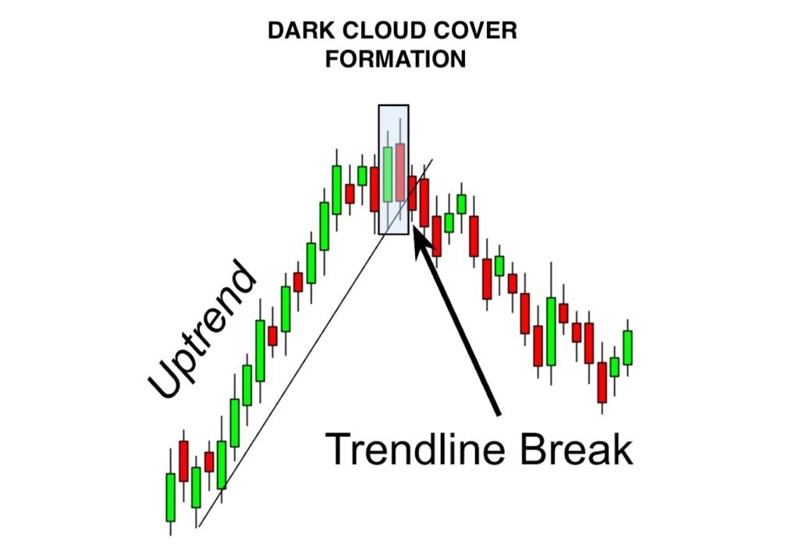
One of the best ways to play this pattern is in an overall downtrend during a short-term reversal. As the stock tries to rally into resistance, you can anticipate the end of the rally.
Entry:
Positions should be entered as the stock breaks the prior bar with stops set at the high of the candle.
Three Black Crows
The Three Crows pattern is a bearish reversal pattern that consists of three bearish long-bodied candlesticks.
Each of the three candlesticks should be a long-bodied bearish candlestick, each candlestick's opening price should be lower than the previous candlestick’s opening price.
It is a bearish reversal pattern; therefore, it should be considered only when it appears after an uptrend. The three patterns signal weakness in an ongoing uptrend and the potential reversal to the downtrend.
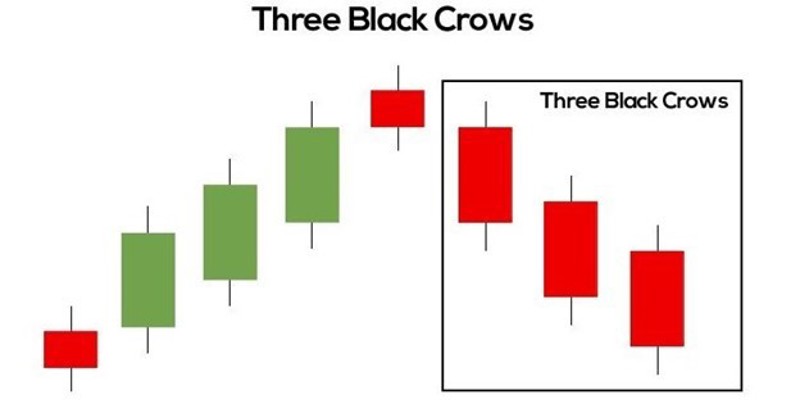
Here, the essential candles traders look for are the three red candlesticks, which usually have short wicks. They show the development of steadily increasing selling pressure and an increasingly lower closing price over the course of three days.
By the time this trend ends, the asset’s closing price will have dropped to a much lower level than before. The tiny green candle with the long shadow is called an inverted hammer or shooting star. It shows that the market did reach a high that day, but buying pressure was very low.
As a result, in this article, we rewired one of the most used bearish candlestick patterns. Those patterns can be applied to most financial markets, which could be a good way to start your technical analysis. By learning about these chart patterns, you will be able to learn how to profit from these technical price patterns. Please do not forget to visit our previous article to learn every detail about candlestick patterns. For more information, please do not forget to visit Aryatrader.com and follow our other social media accounts to discover the benefits of artificial intelligence in your transactions.
Watch our video for detailed explanation!