Blog
What is Awesome Indicator? Trade risk-free!
Dear Arya Trader followers and investors, we are here with another indicator that is not very common in our article training series but will make important contributions to your trade strategy. As can be understood from its name, it provides an awesome analysis technique. With the awesome oscillator, you can trade risk-free by measuring market momentum. Let's take a closer look at this indicator…
Thanks to this indicator, you can make a rational buy-sell transaction and secure your investments. By using this oscillator, which is among the most reliable tools to measure market momentum, you can confirm trends and easily observe returns.
The Awesome Oscillator was developed by American stockbroker Bill Williams. Apart from Awesome (AO), Mr. Williams has developed many other technical analysis methods such as Alligator Oscillator, Fractals Indicator, and MFI. He also has many articles and books on topics such as chaos theory and investment psychology.

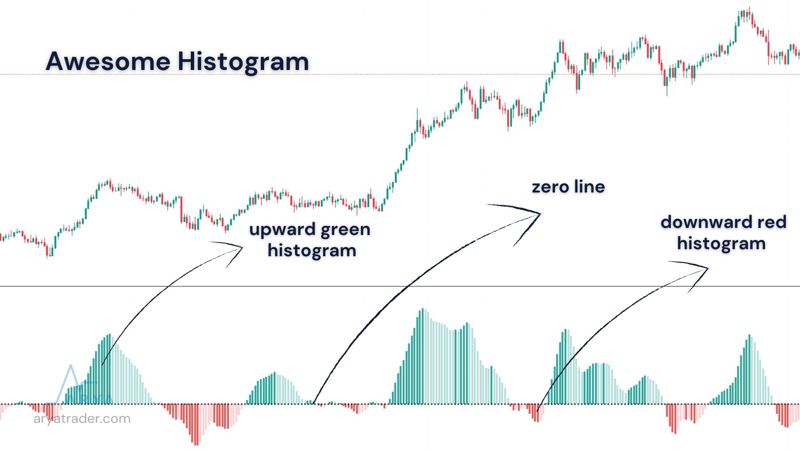
When we enable the Awesome indicator on the intermediary platforms, there is an upward green and a downward red histogram with the simplest observation. These two exchange lines are also divided by the zero line. Now let’s take a closer look at these indicator pieces…
As for the working logic; Awesome indicator is a form of analysis that produces value by working with the Moving Average principle. Based on 34-period and 5-period simple moving averages, it produces results from the difference.
However, when calculating, it examines the moving average based on the midpoints of both bars, not the closing price. The formula for the Awesome indicator is calculated in three steps;
- Step 1: 5 Period SMA = Bar high – Bar low / 2
- Step 2: 34 Period SMA = Bar high – Bar low / 2
- Step 3: Awesome Oscillator = 5 SMA – 34 SMA
I've included this formula in this section just to give you an idea. The calculation is automatically displayed on intermediary platforms.
How to Use Awesome
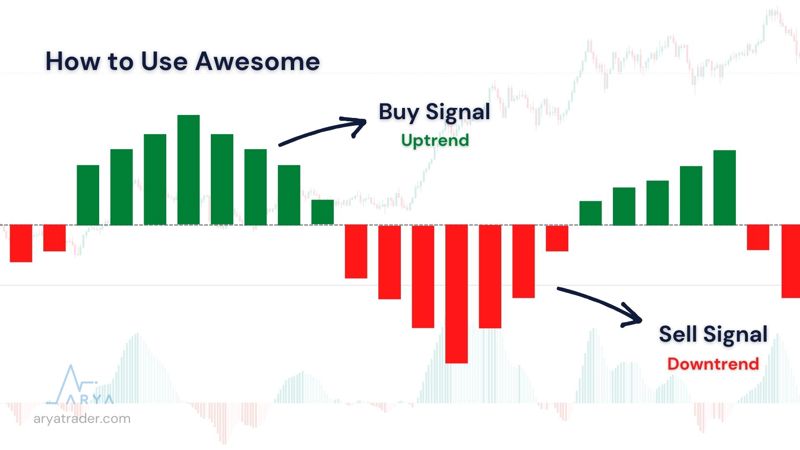
The Awesome indicator gives users buy-sell signals with the histogram image created above and below the zero-line crossing. The green histogram, which goes above zero, gives the user a buy signal that the uptrend has started. Conversely, the red histogram below the line also shows the downtrend and the sell signal.
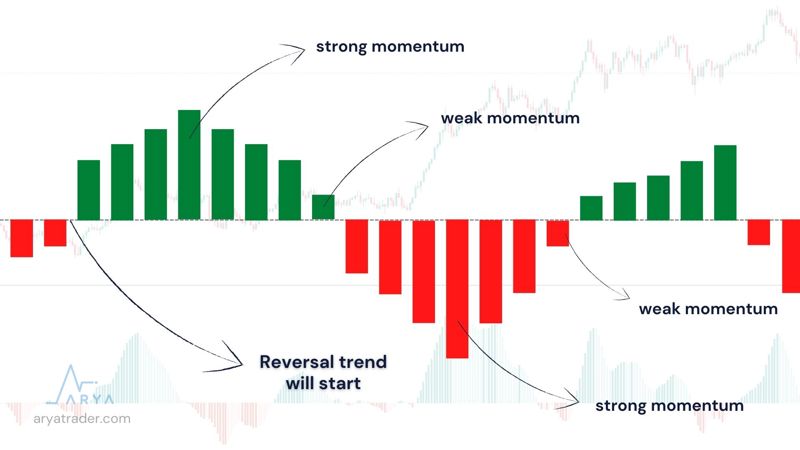
In these histograms, bar lengths and hues are also related to momentum strength. The darker the color, the longer the bars show, and the stronger the buying-selling power. When these bars reach zero, it means that the reversal trend will start.
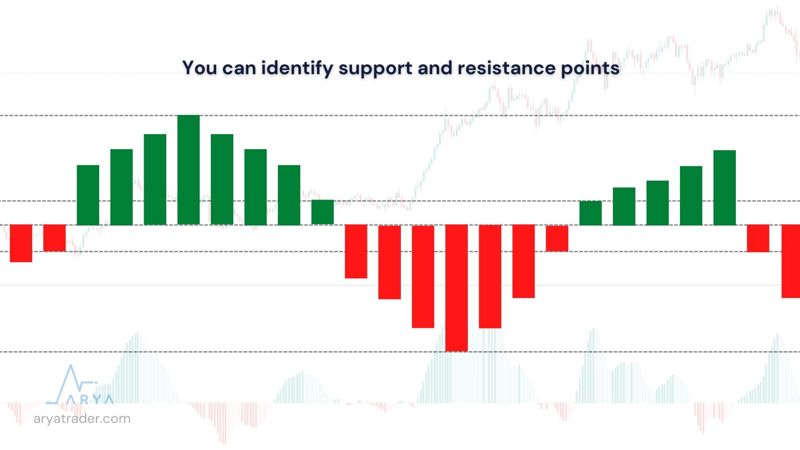
This indicator can also be used to measure support-resistance levels. By determining the peak-trough points of the histogram values as support-resistance, the next high or low points can be determined.
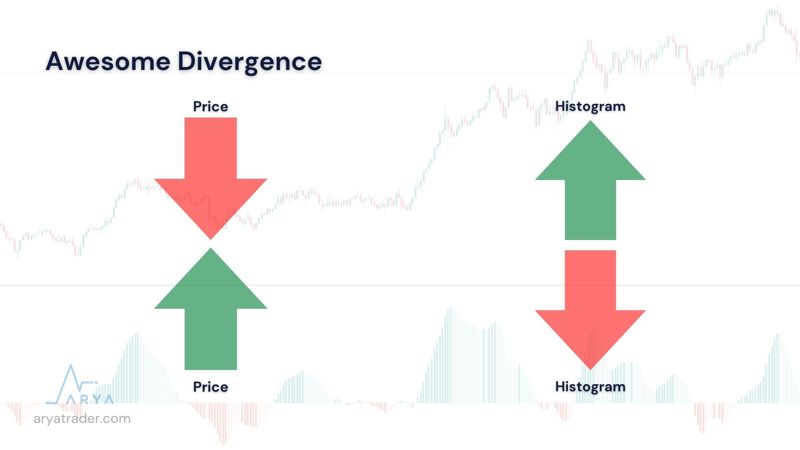
Awesome Divergence
As seen in all indicators, discrepancies with price can be recorded in this indicator. If the histogram gives the opposite signal when the prices are moving down, or if the histogram gives the opposite signal when the prices are moving up, it means that there is a mismatch.
The thing to do is to try to determine the correct result with an auxiliary indicator.
Awesome + Indicators
Although Awesome is a successful indicator, it is risky in terms of giving accurate results, just like other indicators. It is necessary to use auxiliary indicators. It is extremely important to confirm with volume indicators. Especially with RSI, much more accurate results are obtained in dual use. Helper that can be used with Awesome
The indicators are:
• RSI
• MACD
• Stochastic
• DMI
• OBV
• ADI
Watch our video for detailed explanation!