Blog
What is the Aroon Indicator? The best trend finder!
The Aroon Indicator works as one of the best technical analyses on “Trend Finding”. For Arya Trader’s followers, we discussed questions such as what is the Aroon Indicator, who found it, and how to use it.
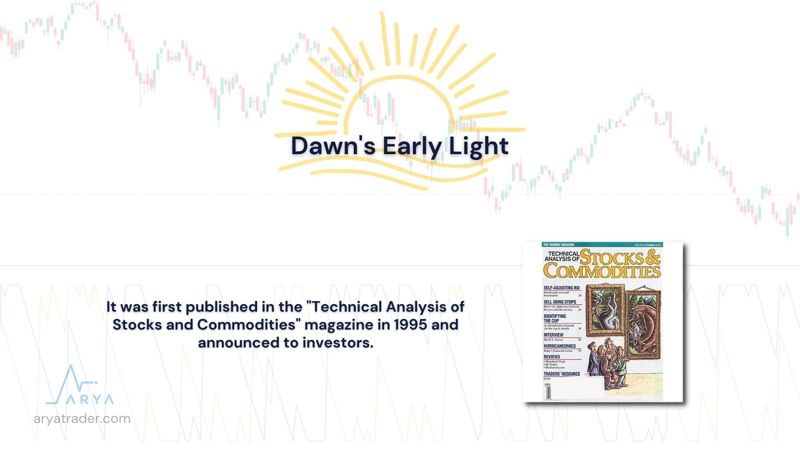
The Aroon indicator is named after a Sanskrit word meaning “Dawn's Early Light”. The reason why it got this name is that it was produced to detect a trend while it was still in the formation stage. It was first published in the "Technical Analysis of Stocks and Commodities" magazine in 1995 and announced to investors.
Tushar Chande of Indian origin developed the Aroon indicator. Investment expert and author, Chande studied materials engineering in the United States. Focusing on finance while pursuing his doctorate, Mr. Chande has written many books on technical analysis and made important technical developments. Mr. Chande is also the founding partner and head of research at Rho Asset Management in Switzerland.

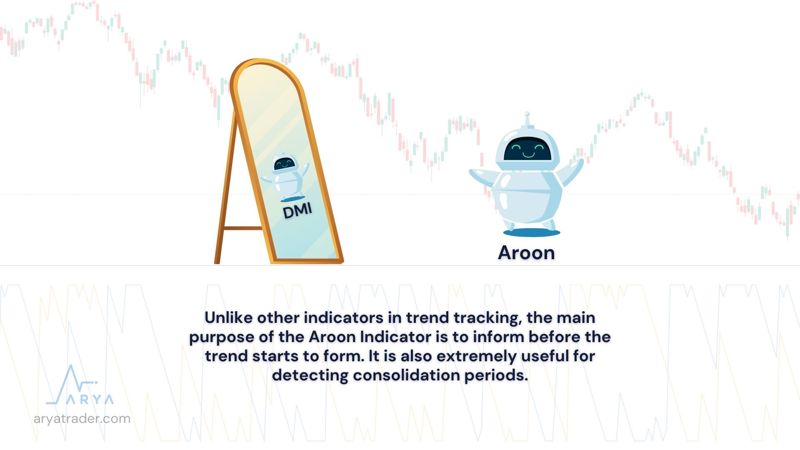
The Aroon Indicator bears a similarity with the DMI developed by technical analyst J. Welles Wilder, whose name we have frequently mentioned in previous articles. Unlike other indicators in trend tracking, the main purpose of the Aroon Indicator is to inform before the trend starts to form. It is also extremely useful for detecting consolidation periods.
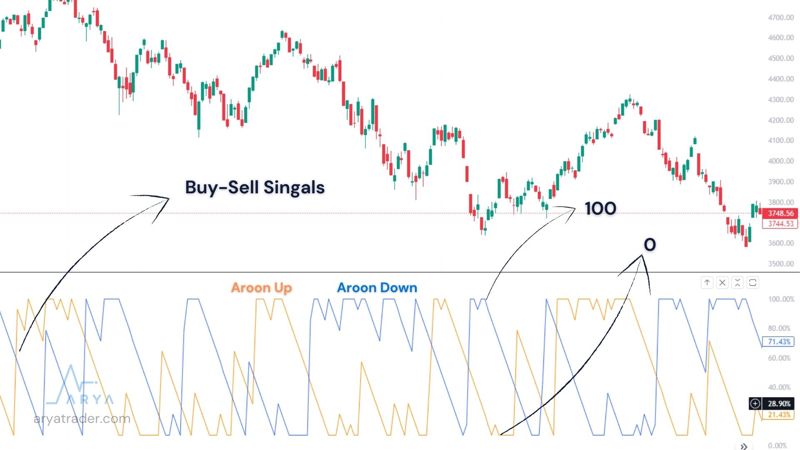
This indicator, which is used to determine the trend, proceeds in the form of two linear lines on the graph. These lines inform the investor that the price of the traded financial asset has passed from the trend period to the buying-sell period. While giving this news, it produces a value between 0 and 100 on the graph.
Before going into the details of the Aroon indicator, I also include the calculation formula in this part of the article so that you have an idea. However, you do not need to use this formula, as the chart will appear ready-made on the investment tracking platform you use. The formulas of the indicator with two different value lines are as follows;
- Aroon Up: [(period specified − number of periods since the highest high) / period specified] x 100
- Aroon Down: [(period specified − number of periods since the lowest low) / period specified] x 100
Aroon lines have been developed on the basis of 14-day averages. If the investor wishes, he can manually change the calculation period and create new strategies. However, it is seen that the most common and healthy use is in the form of a 14-day period.
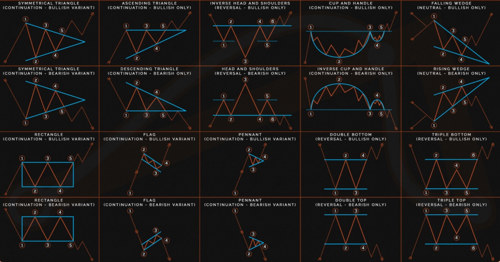
There are basically three interpretations based on the Aroon lines. These;
- Endpoint Values
- Parallel Movements
- Intersections
It examines the form. Based on these movements, important conclusions are drawn for trend finding and buy-sell decisions.
1. Endpoint Values
If the Aroon Up line is hovering at 100, this can be interpreted as a power indicator. While this value line is in the 70-100 range, the start of a new upward trend can be predicted. Conversely, if the Aroon Down line is in the 70-100 range, there may be a downtrend.
For a strong uptrend, Aroon Up should be between 70-100 and Aroon Down should be between 0-30. For a new downward trend, this time Aroon Down should be between 70-100 and Aroon Up should be in the range of 0-30.
2. Parallel Movements
If the Aroon Up and Aroon Down lines run parallel, it strengthens the possibility of consolidation. In this period, neither the Bullish nor the Bearish Trend is as strong and it shows the period of sideways trading.
3. Intersections
If the Aroon Down line crosses above the Aroon Up, there is no strong trend and a downward movement is expected. On the contrary, it is interpreted as a strong and upward trend.
Aroon Indicator and Auxiliary Indicators
As we mentioned in previous training articles, no single indicator is sufficient to trade. Always making multiple calculations in the financial markets will keep your investments safe. For this reason, it is extremely important to get confirmation from auxiliary indicators while using the Aroon Indicator. The indicators that work in harmony with Aroon are mainly as follows;
- Moving Average (MA),
- MACD,
- WaveTrend (WT).
In summary, Aroon Indicator,
- Gives extremely successful results in finding trends,
- Allows you to profit by detecting general trends early,
- Allows you to easily determine the consolidation periods,
- Extremely successful buy-sell transactions can be made using auxiliary indicators.
Watch our video for detailed explanation!