Blog
What is WaveTrend Indicator? A Multifunctional Tool!
The main purpose of this oscillator, as the name suggests, is to center the trend wave, that is, the movements of the trend. In addition to generating a buy-sell signal, WaveTrend also shows which direction the trend direction is. In this respect, it is also correct to say that it is a functional indicator. In addition, overbought zones are also included in the chart.
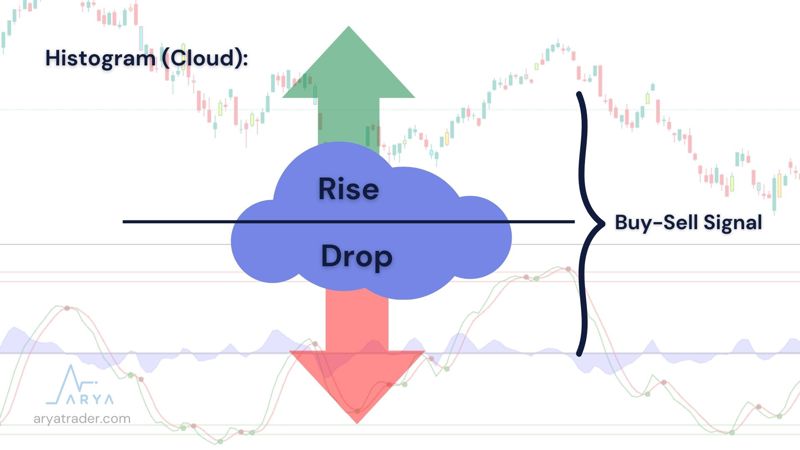
The WaveTrend indicator has an appearance of a dense chart. The WaveTrend indicator has a dense chart appearance. There are overbought-sold lines, two lower and two uppers, clouds (histogram) in the middle, and two value lines advancing above them.
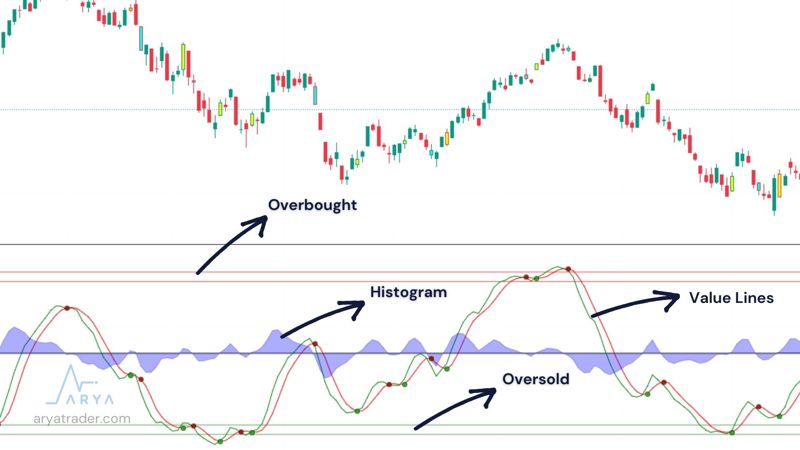
This indicator, which takes place on the chart as two value lines, also has a cloud wave on the midline. This cloud wave forms a downward and upward shape. Clouds above the midline represent the rise and the lower part of the fall. For the buy-sell signal, these clouds also allow us to make important inferences.
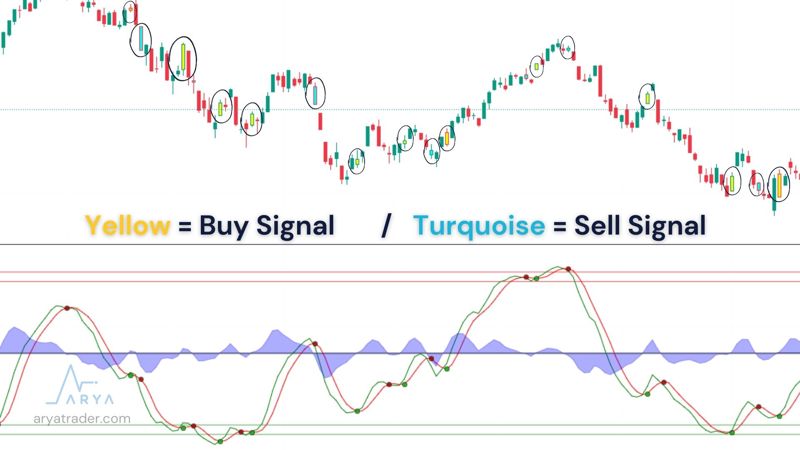
The green line crosses the red line upward, creating a buy signal here. And prices also move upward in this case, except during periods of conflict. Even if the green line crosses the red line downwards, it creates a sell signal. It also gives the green and red points indicating these signals near the intersection.
How to Use WaveTrend?
We stated that the indicator leaves green and red dots on the trading points. Simultaneously, price candles change colors to yellow if it is the buy signal and turns to turquoise if it is the sell signal on the chart.
In order to get the most accurate results from this indicator, it is necessary to trade in 12-hour or 1-day periods instead of very short intervals. In short-term transactions, too many signals will be generated, which may cause you to make incorrect transactions.
WaveTrend Divergence
Of course, there may be a divergence between price and oscillators in this indicator, as in other momentum indicators. For instance, under normal conditions, if rising peaks or falling lows are emerging, we confirm the same on the oscillator. But it is not always happening in this way. Progress is made in different directions when the momentum does not approve the price and these situations are called divergence.
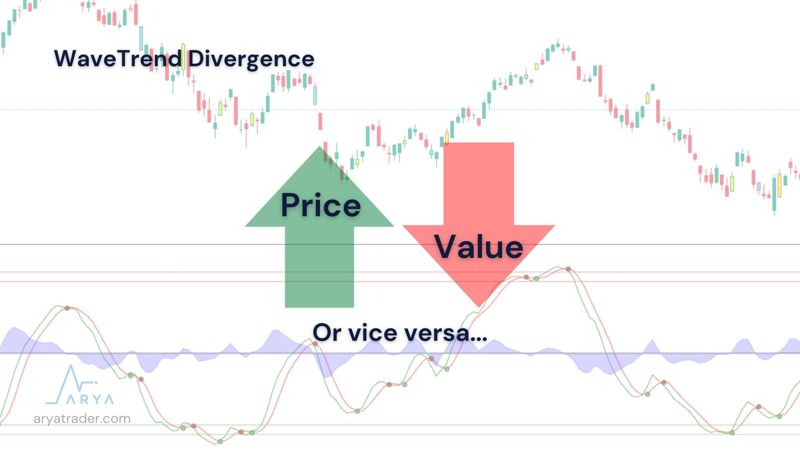
These inconsistencies are named in two ways;
- Regular Bearish Divergence: While the price is peaking high, the indicator is peaking evenly. As a result, prices decline.
- Regular Bullish Divergence: The indicator has made a higher bottom although price movements have bottomed out evenly. As a result, prices increase.
Wave Trend + Indicators
It should be noted that no indicator, including WaveTrend, gives results on its own. Therefore, confirming with more than one indicator or making a joint analysis will give more accurate results.
The most frequently used indicators with WaveTrend are as follows;
- WMA
- CMF
- RSI
- MACD
Apart from these, you can develop your own analysis method by getting support from other indicators.
Watch our video for detailed explanation!