
Blog
What is Chaikin Money Flow (CMF)? Measure Market Power!
In this tutorial, we examined the CMF indicator with all details you should know. This indicator takes its name from the abbreviation of the words Chaikin Money Flow. At the end of this tutorial, you will have an idea about the history, usage, investor, and strategies of this indicator which measures the power of the market.
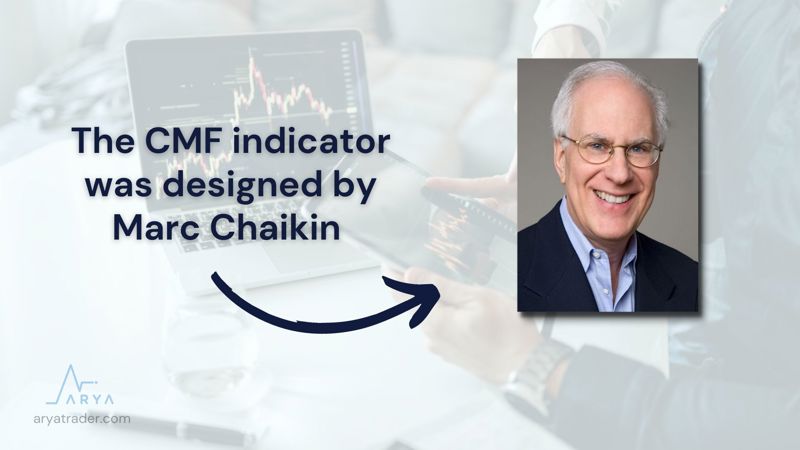
CMF was developed by famous broker Marc Chaikin who also gave his name to this indicator. Chaikin is also the founder of companies including Bomar Securities LP, Chaikin Analytics, and LLC. He also worked as a financial analyst in many TV programs in America.
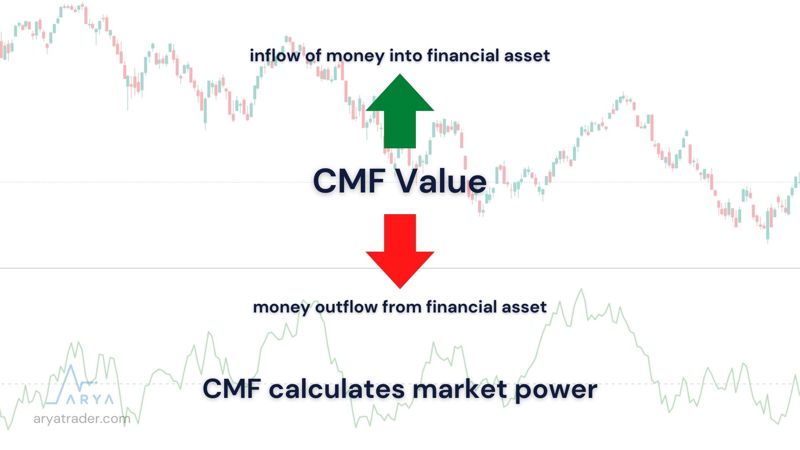
Chaikin calculates the market power with this indicator which he developed with his own analysis methods. This oscillator serves to determine the cash inflow or outflow of a specific financial asset. In short, if CMF rises it means that money inflow happens or if it falls, it means that money outflow happens.
The standard usage determined by Chaikin is taken as a 20-day period. The graphic, which can be also seen in intermediary platforms, will appear with this fixed value. However, according to the strategy calculations, sometimes it is used as 10- 15 and 21 average periods.
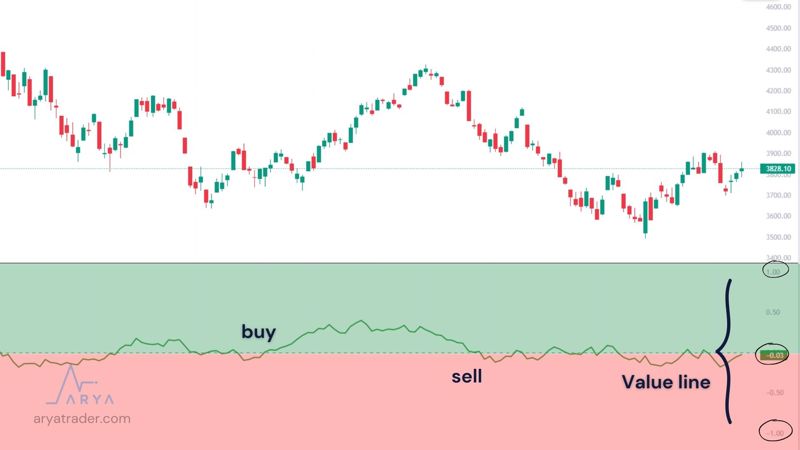
The value line is taken as 0 and goes in a range between +1 and -1. In the simplest terms, while the value below zero is a suitable point for selling; the value line above zero indicates the sign of buying.
Calculation of CMF
If we refer to the calculation formula of CMF, 4 steps should be followed to reach the result.
Step 1: Money Flow Multiplier = [(Close Price – Low Price) – (High Price – Close Price)] / (High Price – Low Price)
Step 2: Money Flow Volume = Volume x Money Flow Multiplier
Step 3: Total Money Flow Volume is calculated. For this, the Money Flow Volume of each founding period is summed up.
Step 4: Total Cash Flow Volume divided by the total volume of the review period.
The result value consists of one line that goes between the range of +1, 0, and -1. However, you do not have to make this calculation. The calculated formula is going to appear in the selection you use in the brokerage house.
CMF indicator divergence is of course seen as in other indicators. If rising highs and falling laws are not in line with the highs and lows formed by the CMF, it is a sign of weakening of the trend and possible reversal. On the contrary, a sign of possible rise appears in a situation where the CMF value makes rising lows while the price makes falling lows.
Advantages of CMF Indicator
- CMF is an important indicator of trending markets
- It is an important tool to confirm the direction of the trend
- CMF can provide possible existing signals when there is potential for trend reversal.
Disadvantages of Chaikin Money Flow Indicator
- It should not be used alone in trading
- Investors cannot determine the potential stop-loss and take-profit points
- CMF may generate wrong signals during range-bound market conditions since values may fluctuate around the zero line
- It should not be used in shorter time periods.
In general, CMF allows you to easily measure buying-selling pressures, it can generate buy-sell signals that come from breaks in the value line, and it can predict the trend reversal in price.
Using CMF + Indicator
It should be noted that using indicators alone is not enough. That is, it is not the right strategy to make your transactions based on a single indicator. You can keep your investments safe by using different several different indicators while trading. Other indicators that you can use along with the CMF are listed as follows:
- RSI
- MACD
- Bollinger Bands
- ADX
- CCI
- Other oscillators may also be preferred for confirmation.
Watch our video for detailed explanation!