
Blog
What is the Parabolic Sar? Stop And Reverse!
Dear Arya Trader followers and investors. As we continue our Forex training series, we are here with another indicator that you must know. We will present you Parabolic Sar with all its details so that you can easily follow price movements, buy-sell signals, and market variables.
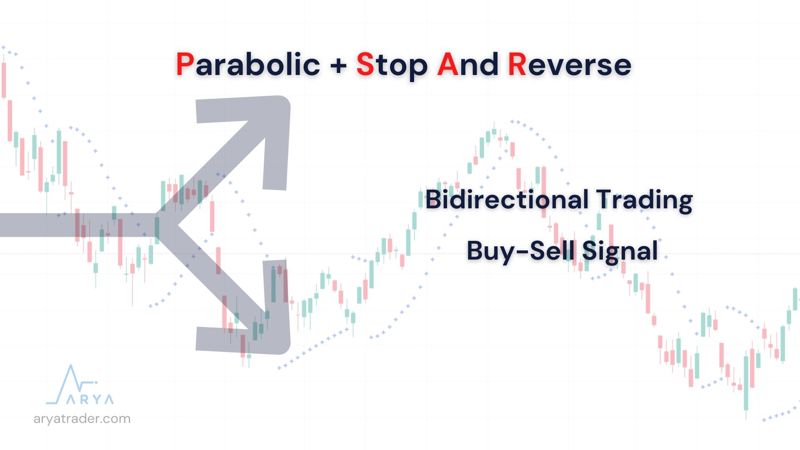
We can say that Parabolic Sar is one of the most compatible indicators in this market, as there is a bidirectional trading opportunity in the Forex markets. Because SAR, the abbreviation of “Stop and Reverse”, comes from this form of operation. Developed for those who will trade bidirectionally, this Parabolic gives important signals in the determination of trading points.
In its most general sense, the Parabolic Sar is an indicator that determines the direction of the price and when it changes direction. It is also known as Parabolic SAR because of the appearance it creates in the form of a parabola.
Parabolic SAR was developed by J. Welles Wilder in 1978. While Wilder was an American mechanical engineer born in 1935, he first dealt with the real estate market and then the financial markets. Since he developed many indicators, he has been called the father of indicators.

The main indicators developed by Mr. Wilder are as follows;
- Average True Range (ATR)
- Average Directional Index (ADX)
- The Commodity Selection Index (CSI)
- The Directional Movement Index (DMI)
- The Parabolic SAR
- The Relative Strength Index (RSI)
- The Swing Index
- The Volatility Index
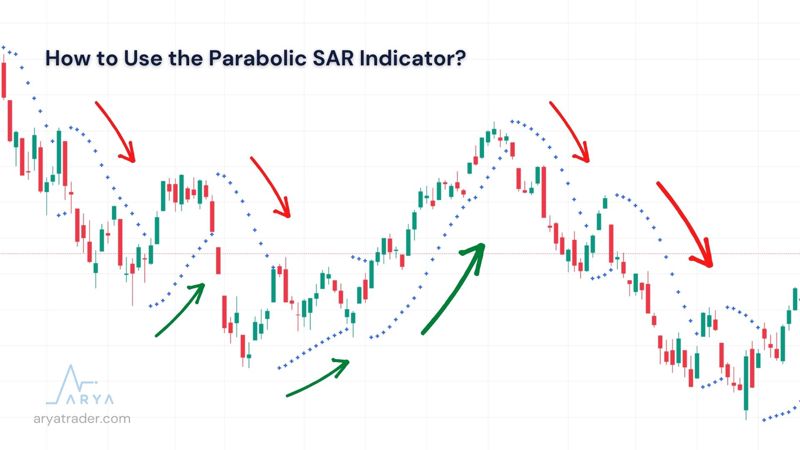
How to Use the Parabolic SAR Indicator?
It consists of a single linear progression that progresses in the form of small dots/pluses on the Parabolic Sar indicator. In the simplest definition, these points (or positives) above the candlesticks indicate that the prices are down, and those below the candlesticks indicate that the prices are up.
You do not need to use the formula that I will explain a little later. I'm attaching it to this section for your opinion. In addition, the formula and usage set will be calculated as in the image. It is recommended that you do not change these settings without knowing advanced technical analysis, because if the result is not interpreted correctly, it may create a wrong trade for you.
Parabolic SAR Calculation
The parabolic SAR (PSAR) indicator uses the most recent extreme price (EP) along with an acceleration factor (AF) to determine where the indicator dots will appear.
The parabolic SAR is calculated as follows:
Uptrend: PSAR = Prior PSAR + Prior AF (Prior EP - Prior PSAR)
Downtrend: PSAR = Prior PSAR - Prior AF (Prior PSAR - Prior EP)
Where:
EP = Highest high for an uptrend and lowest low for a downtrend, updated each time a new EP is reached.
AF = Default of 0.02, increasing by 0.02 each time a new EP is reached, with a maximum of 0.20.
Parabolic Sar in General
Although it is disadvantageous in horizontal markets and long-term investments; It is extremely useful for high volatility and short-term trades. The general contribution of Parabolic Sar, which has not lost its currency for many years, is as follows.
- Following Trends
- Determining the Direction of the Trend
- Generating a Buy-Sell Signal
- Determination of Stop Loss and Take Profit
Parabolic Sar + Indicator
It should be noted that no single indicator is sufficient to trade. No matter how well it produces buy-sell signals, it will be extremely useful to get confirmation from another indicator. Indicators to be used in addition to Parabolic Sar are;
- MACD
- EMA
- Ichimoku Cloud
- Heikin Ashi
- Bollinger Band
Watch our video for detailed explanation!