Blog
What is the KAMA indicator? Get Rid of Market Noise!
In this article, we will talk about the Kaufman Moving Average, abbreviated as the KAMA indicator. We have compiled all the details for Arya Trader followers, who found KAMA, what is its history, how it works, and how it should be used.
As we mentioned, the KAMA indicator is an abbreviation. It is named after its developer, Perry J. Kaufman. Mr. Kaufman developed this indicator, which is still up to date, in the early 1970s. However, it was fully announced to the markets in 1998 with the book "Trading Systems and Methods".
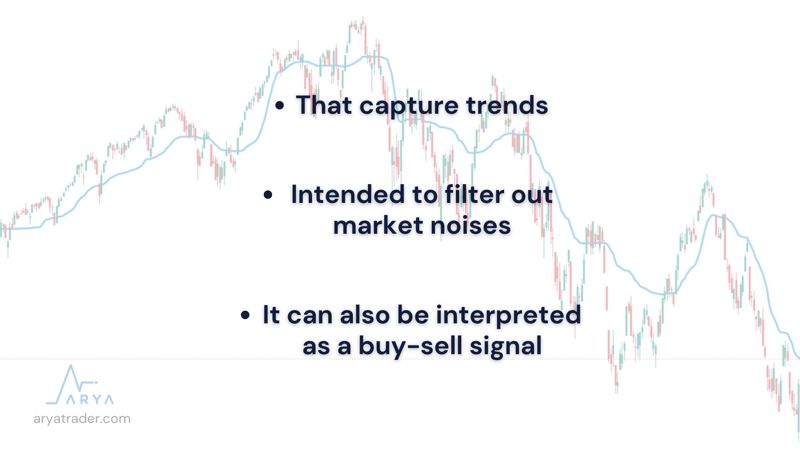
KAMA first with the simplest interpretation is intended to filter out market noises, which are temporary fluctuations in price movements that capture trends. In this way, a clearer view is captured for making trading decisions. Thus, it can also be interpreted as a buy-sell signal.
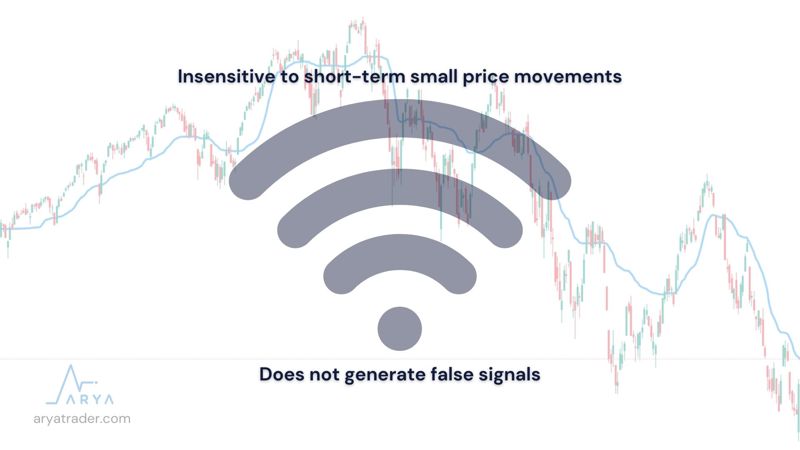
Unlike the calculations of traditional moving averages, it is insensitive to insignificant short-term price movements. In this way, it does not produce false signals and provides healthier analysis. For this reason, many investors use the Kaufman Moving Average to read market movements.
It creates a single linear value as a result of 3 moving averages. It produces values by looking at the values of 10-2-30 periods. However, 14-2-30 period calculations are seen in ready-made indicators that you will use from intermediary institutions. For efficiency, calculations can be made by manually entering different values.
The most frequently used settings when calculating the KAMA indicator are as follows;
- 10 periods: Number of periods for Efficiency Ratio
- 2 periods: Number of periods for the fastest exponential moving average
- 30 periods: Number of periods for the slowest exponential moving average
KAMA has a calculation formula consisting of 3 steps. You do not need to use this formula while you are trading, but I am adding it to this section for you to get an idea;
Step 1. Finding Efficiency Ratio
ER = Change/volatility
Change = Absolute Value [Close – Close (last 10 periods)]
Volatility Sum = 10 periods (Close – Previous Close)
Step 2. Smoothing Constant Calculation
SC= [ER x (Fastest SC – Slowest SC) + Slowest SC]2
SC= [ER x (2/ (2+1) – 2/(30+1)) +2/ (30+1)]2
Step 3. KAMA Calculation
It is calculated as KAMAi = KAMAi-1 + SC x (Price – KAMA i-1).
How Does KAMA Work?
Kaufman Average is a method that analyzes historical data by examining it. While most brokers have a period interval of 21 on the platform, some are assumed to be 14. However, you can choose a value on a wide scale between 2 and 1000 according to the financial asset you are trading.
In general, KAMA, which produces a single value line on the chart; If it is in a downward movement, it reflects the presence of a downtrend, and when it moves upwards, it reflects an uptrend. By examining the intersections of both short and long-term KAMA values, buy-sell signals can be easily created.
However, it should be noted that no single indicator is sufficient to trade. No matter how well it produces buy-sell signals, it will be extremely useful to get confirmation from another indicator. WaveTrend or RSI can be preferred to confirm the KAMA indicator in trading assets. But besides these;
- MACD
- Stochastic
- CCI
- ATR etc. other technical analysis should be used…
Watch our video for detailed explanation!