
Blog
What is ADX Indicator? The method that saves from false signals!
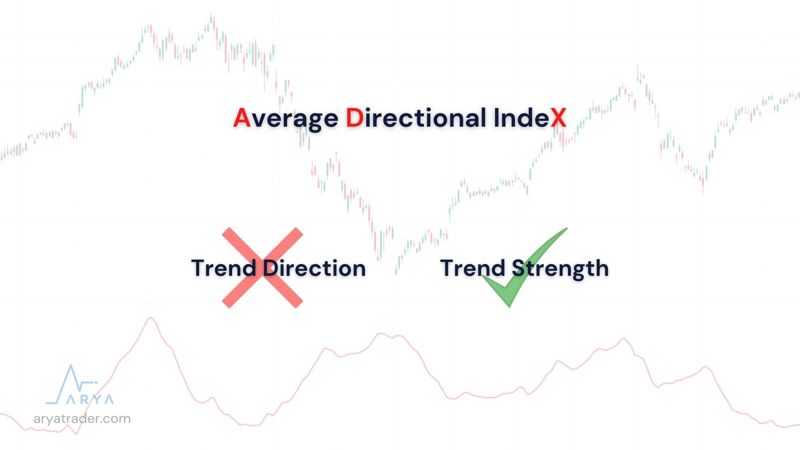
The ADX indicator takes its name from the abbreviation of Average Directional Index. ADX is an indicator developed to measure the strength of the trend. This indicator serves to measure the strength, not the direction, of the trend but it is also useful for getting rid of false signals.
ADX indicator was developed by J. Welles Wilder in 1978. While Wilder was an American mechanical engineer born in 1935, he was first interested in the real estate market and then the financial markets.
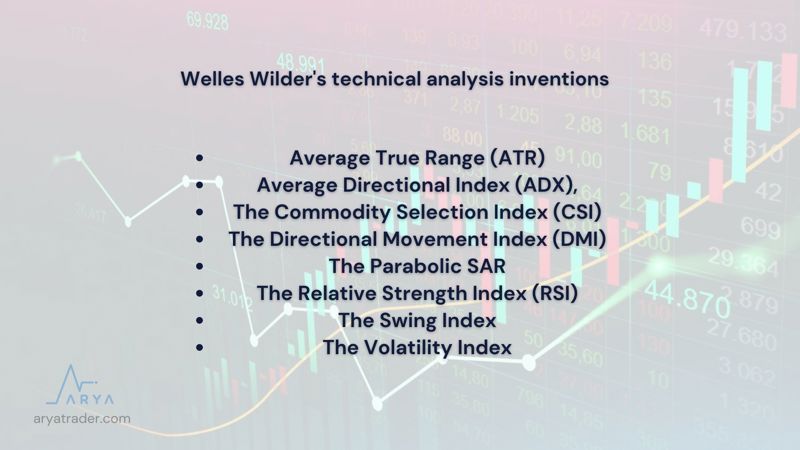
In addition, Wilder is an investor of many other technical methods including ATR, CSI, DMI, RSI, The Swing Index, The Volatility Index, and the Parabolic SAR. He has been called the father of indicators by publishing many articles and books about those indicators.
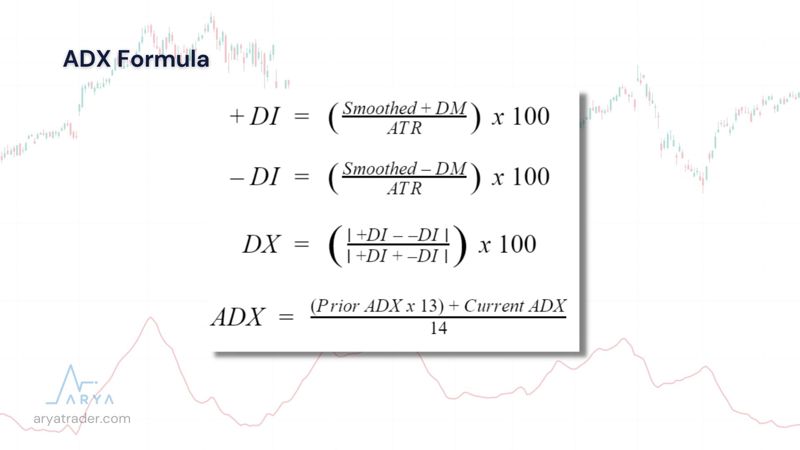
Although ADX has a very complex formula structure, the image of the formula is added in this part of the article for those who want to know more about it. However, you do not need to calculate when using this indicator in the program you use as an investment agent. After selecting the indicator, the indicator comes with calculated results.
So, what does ADX show us? ADX is a technical tool that does not show the direction of the trend but only the strength of the trend. An increase in the ADX indicator indicates the existence of a strong trend. That is, it’s not an increase and decrease in prices, it’s about how strong the trend is going.
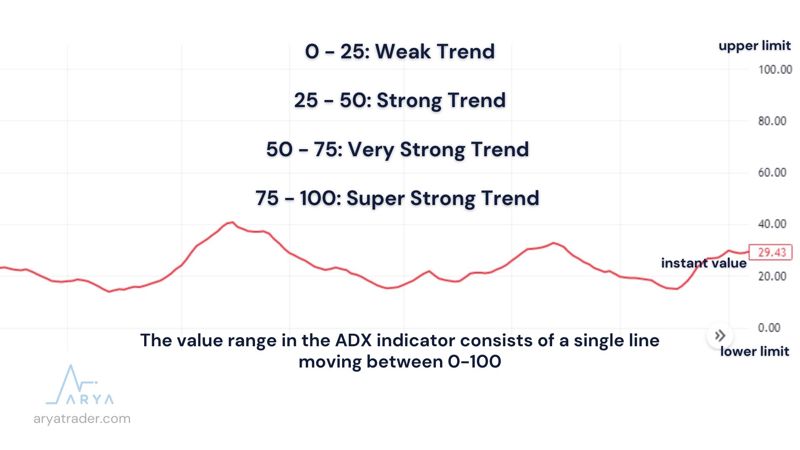
The value range in the ADX indicator consists of a single line moving between 0-100. The value figure on this line, called the ADX value, shows the strengths of the trend. If we categorize these values, 0 to 25 is called a Weak trend, between 25 and 50 is called a Strong Trend, between 50 and 75 is called a Very Strong Trend, and finally, the value range of 75 to 100 is called Super Strong Trend.
According to the investors who make a trend strategy, values in the range of 0-25 are not sufficient to measure the trend. This Weak Trend range, which progresses depending on the horizontal movement, will eventually change. However, it should be noted that a decrease in Trend Value is not associated with a reversal of the movement. This indicates that the trend is weakening.
After the ADX value rises, the trend weakens and crosses the horizontal movement; Then, the ADX value makes a lower peak while the prices are on the rise, indicating a Bearish Divergence. This mismatch is also a warning that price momentum is changing. In these cases, it may be appropriate to raise Stop Loss levels or Take Progressive Profits. Because the reversal of prices after a point becomes stronger.
When ADX rises above 25, the price is strong enough to continue in the breakout direction. However, to reiterate, ADX is an indicator that measures trend strength and is not used to determine direction. However, buy and sell transactions can be done easily with some indicators that work in harmony with ADX. The first of these is the DMI indicator.
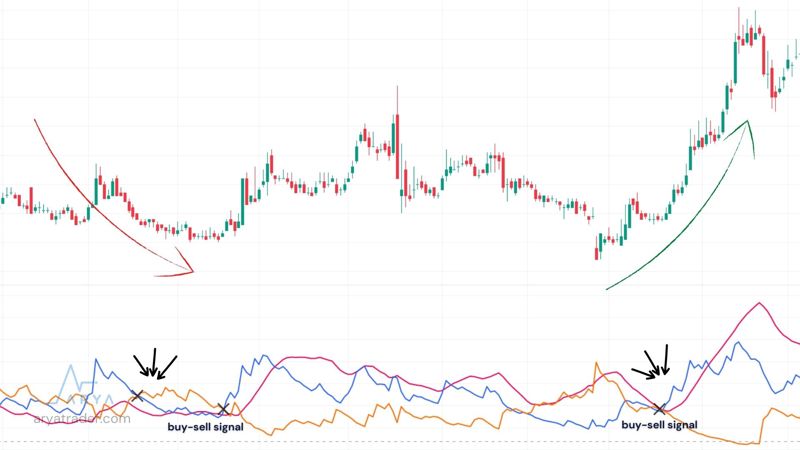
The DMI indicator takes its name from the initials of the words Directional Movement Index. When DMI is used with ADX, it also helps you to make trend reversals, that is, buy-sell transactions while determining the trend.
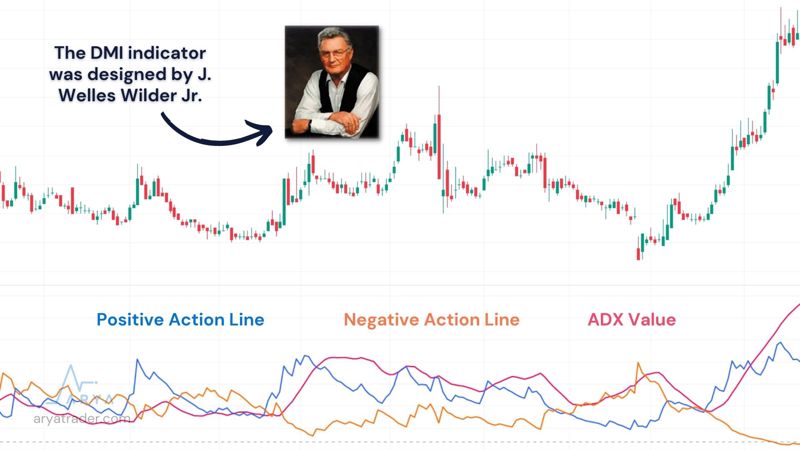
DMI indicator is also an analysis method developed by J. Welles Wilder. In this method, which he developed in 1978, we see value ranges in three different lines. The blue value line represents the Positive Action Line; The orange value line represents the Negative Movement Line, and the pink value line represents the ADX value.
If we examine what these lines mean; If the Positive Action Line is below the Negative Action Line, the downward pressure in prices is stronger. Conversely, when the Positive Action Line is above the Negative Action Line, it means that there is more upward pressure on prices. The crossing between these lines is also used as a buy-sell signal.
In summary, ADX Indicator:
-
Measures the trend strength of the financial asset,
-
ADX is generally measured in a 14-period calculation,
-
The fact that the ADX value starts to rise from low levels means that a new trend will emerge, while if it starts to fall from high levels, it can be interpreted that the market will enter a consolidation period for a while,
-
While producing values between 0-100, values below 10 and above 70 are rarely encountered,
-
If ADX and DMI are considered together, buy-sell signals can be reached,
-
Buy-sell signals can be generated by using Stochastic and RSI together with ADX,
- By using ADX and MACD, trend strength, direction, and momentum can be confirmed.
Watch our video for detailed explanation!