
Blog
What is the Moving Average (MA)? And SMA, EMA, WMA...
Dear Arya Trader followers and investors, in this article series, we will present one of the must-know indicators in your transactions. We continue our series with moving averages which are divided into three categories.
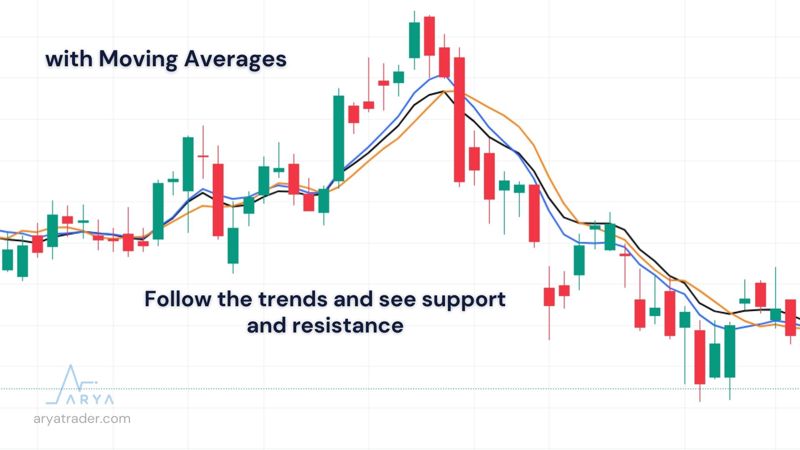
For most traders, the Moving Average is the best way to follow trends. While this indicator is an indispensable tool for those who want to follow the trends, it also allows you to follow the support and resistance. In this way, investors can easily manage risks.
In addition, another critical future of the Moving Average indicator is that it forms the basis of most indicators. The moving average indicator is also used as the component of many indicators. For these reasons, it always maintains its place in the list of most important indicators.
Moving Averages are classified into three subcategories. Those categories are:
- Simple Moving Average (SMA)
- Exponential Moving Average (EMA)
- Weighted Moving Average (WMA)
This classification is made according to the way the formulas are calculated, and it should not be forgotten that the purpose of the use of each of them changes according to the situation and gains importance. It is essential that you invest in which investment asset along with your investment budget and investment period.
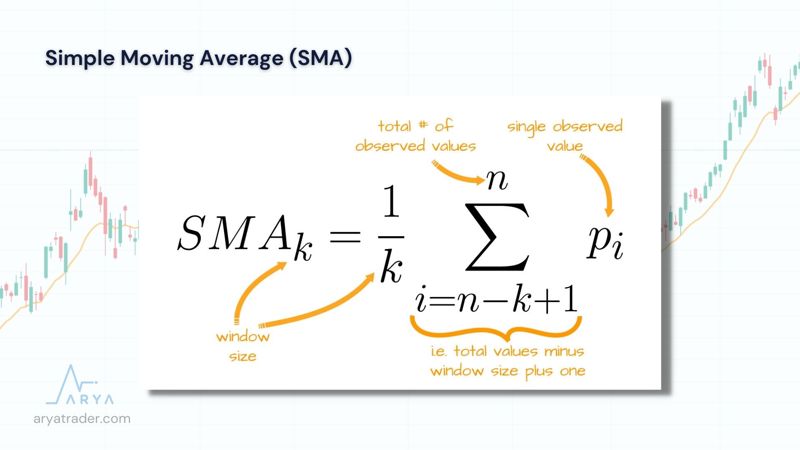
Simple Moving Average (SMA)
It is the most widely used type of moving average. It is calculated by averaging the daily closing prices of a financial asset within a certain period.
The formula is as in the image.
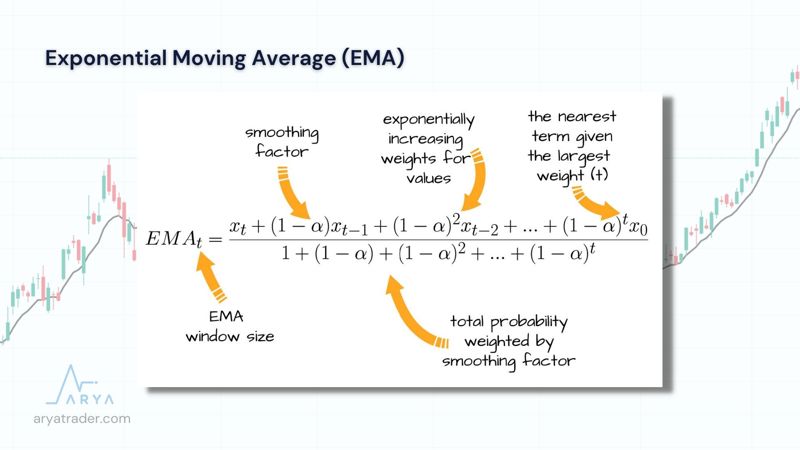
Exponential Moving Average (EMA)
Unlike the Simple Moving Average, it is calculated by taking the average of the price movements of the investment asset within a certain period but by giving weight to the near-term movements. The exponential moving average should lag less because of pulling the weight in a specific direction.
The formula is as in the image.
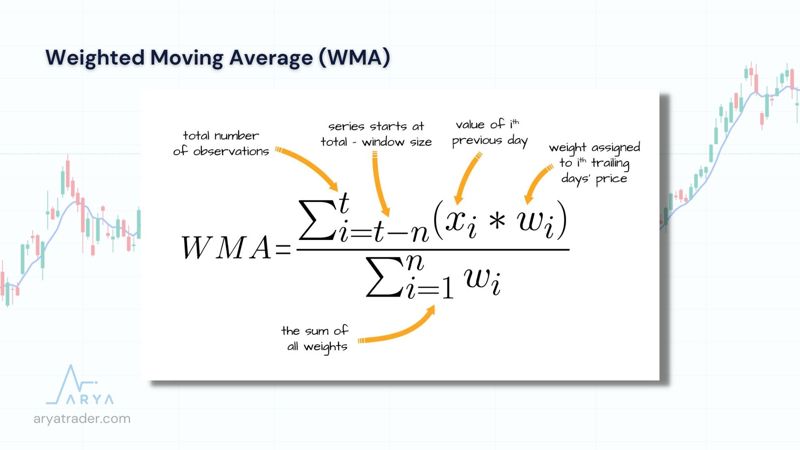
Weighted Moving Average (WMA)
It is calculated by calculating the prices of the traded investment asset within the specified period according to the determined weights. In this way, it is similar to the exponential moving average. Returning to the first day from the last day, the weight order is calculated in such a way that the importance decreases.
The formula is as in the image.
How is Period Selection Determined?
By far, we reviewed three types of moving averages. So now, let’s learn how to determine the period range using these averages. Firstly, we should consider that this selection should be specific to the investment instruments.
Although it seems that the periods are frequently used as 50, 100, and 200 in the markets, there is no such thing as staying constant in these numbers. It is crucial in which period and which financial asset you use. By examining how many candles the asset is, it will be better to reach the calculation with various trials.
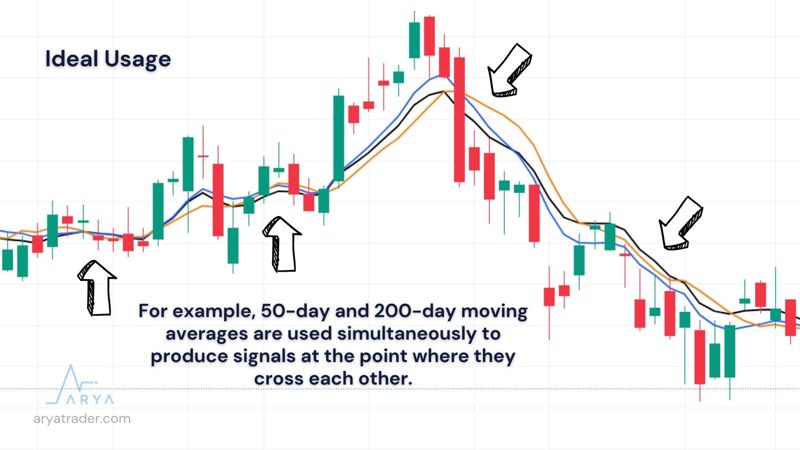
Ideal Usage
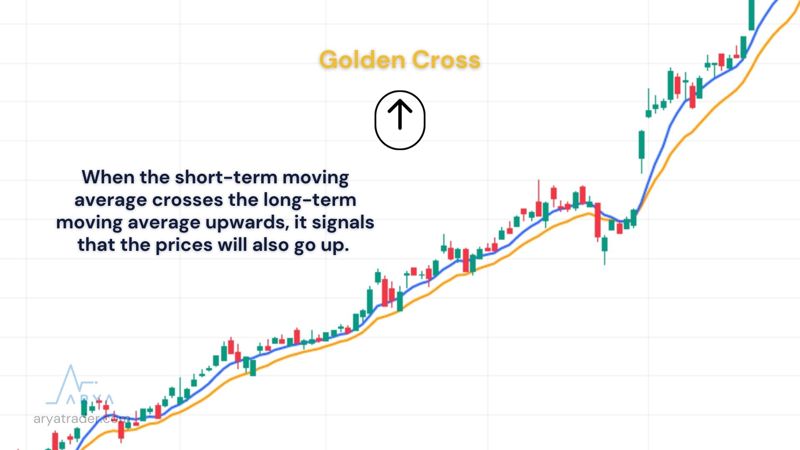
Most of the traders analyze using moving averages together. For example, 50-day and 200-day moving averages are used simultaneously to produce signals at the point where they cross each other.
When the short-term moving average crosses the long-term moving average upwards, it signals that the prices will also go up. This is called the Golden Cross in the financial literature.
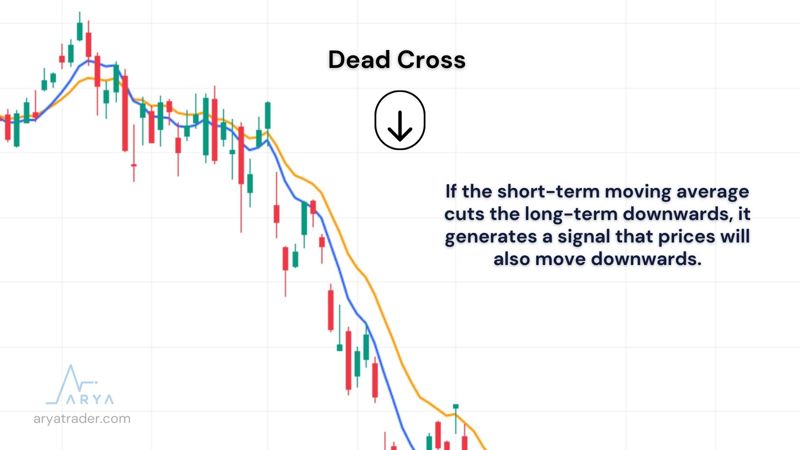
In the opposite case, if the short-term moving average cuts the long-term downwards, it generates a signal that prices will also move downwards. This is called the Dead Cross in the literature.
Things to take into consideration;
1. It is essential not to forget that moving averages are always lagging, and they are reactive indicators,
2. They are not useful for predicting price movements,
3. It is extremely important to use an additional indicator in trading,
4. It is essential to choose which average value you choose according to the type and the time of the investment asset,
5. Combining both short-term and long-term moving averages gives better results.
Watch our video for detailed explanation!