Blog
What is the Bolinger Bands? And details of Rational Analysis...
Bollinger Bands (BB) were developed by John Bollinger in the early 1980s. American-born Mr. Bollinger is an author of numerous articles and books on technical analysis. Mr. Bollinger, who owned a computer in 1977, was also among the pioneers of computer-aided technical analysis.
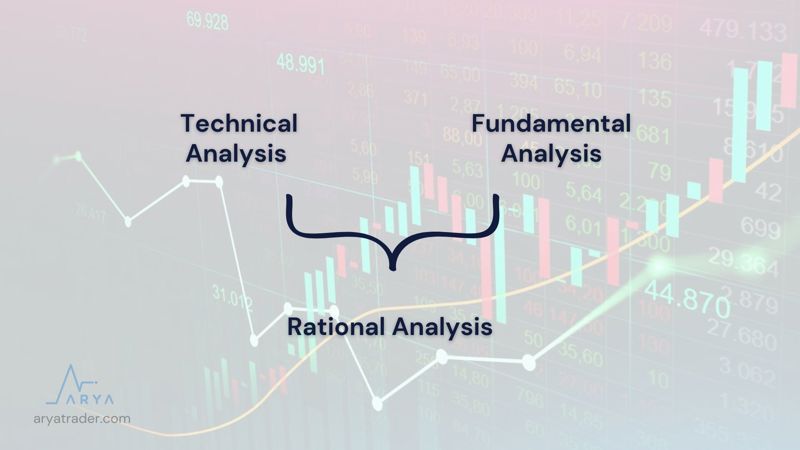
There is also an approach called Rational Analysis that Mr. Bollinger developed to bridge the gap between technical analysis and fundamental analysis. This approach also developed his multiple perspectives in technical analysis.
Now, if we come to Bollinger bands; They are bands that measure volatility, that is, volatility in prices, by definition. Investors also use it extensively to identify reversal points in prices. It is also one of the most useful tools for volatility-based analysis.
If we examine the exit point of Bollinger bands, it is that the prices of the investment asset remain within a certain standard deviation range according to the normal distribution. This standard deviation is calculated to show the percentage distribution of certain statistics. However, you do not need to use the account's details. In the intermediary platform applications you use, this calculation will take place in the graphic ready.
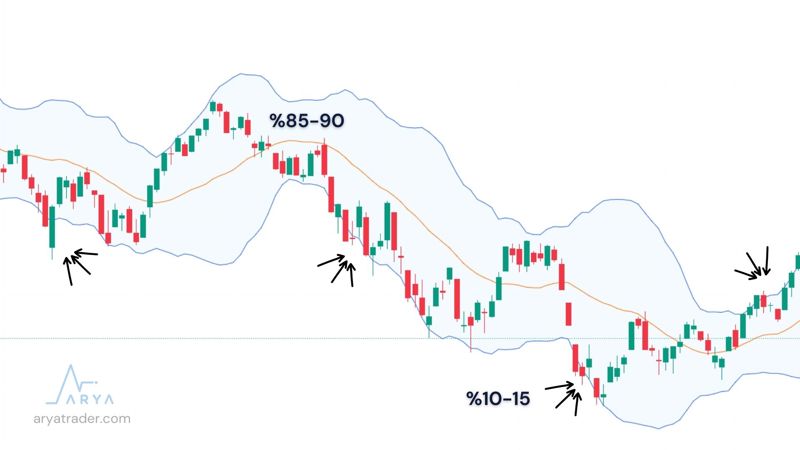
If we come to the value lines of the Bollinger bands, the price of the investment asset in general is in this band range with a rate of 85-90%. If it is outside of these two standard deviation lines, there may be an overflow of 10% as lower and upper. However, in rising or falling trends, this overflow can reach 18-19% levels.
Narrowing and Widening of Bands
The narrowing and widening of Bollinger bands are shaped by the standard deviation. If the average of the deviation of the asset value is low, the bands will narrow, and if it is large, they will widen.
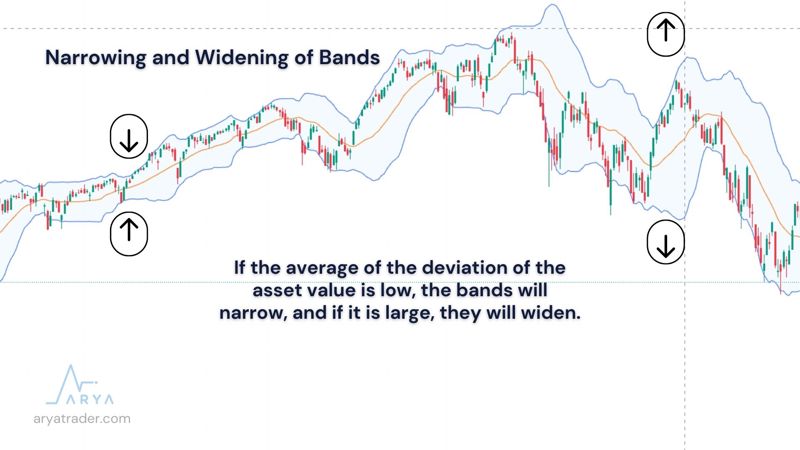
Tape Narrowing;
- The closing value close to the average in the prices of the traded asset reduces the standard deviation,
- The lower and upper bands narrow with decreasing standard deviation,
- Contraction may indicate that there will be movement in prices, but the direction is not clear,
- After the band narrows, trend movements begin.
Band Expansion;
- Increase the standard deviation of the closing value close to the average in the prices of the traded asset,
- The lower and upper bands widen with increasing standard deviation,
- Enlargement indicates that the movement in prices will end,
- After band widening, trend movements end.
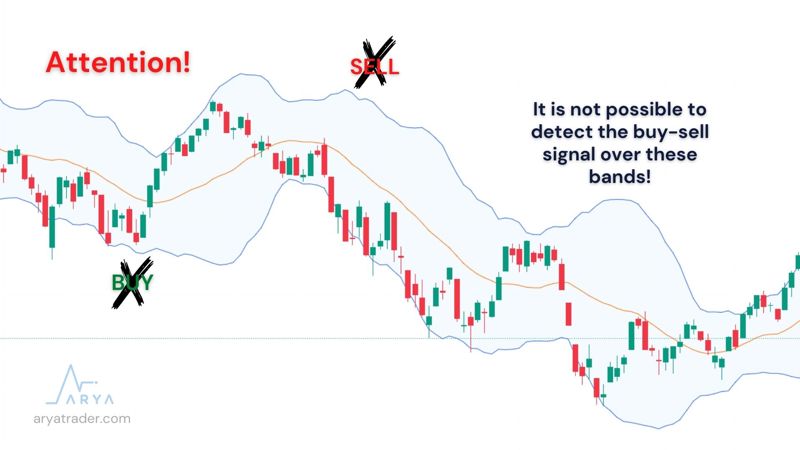
Attention! It should be noted that the price lines being close to these bands is not an accurate method to determine the direction. In addition, it is not possible to detect the buy-sell signal over these bands. Analysis should be done with at least one indicator component.
Rules of Bollinger Bands
I have simplified and itemized the rules that Mr. Bollinger frequently repeats and which should be carefully considered for you, Arya Trader followers. Here are those rules;
- Bands show us high and low price values,
- By comparing the price movements with the use of additional indicators, a Buy-Sell decision can be made,
- Using Bollinger alone is not possible for a comprehensive analysis,
- Price-Band theme should not be considered as a Buy-Sell signal,
- In an uptrend, prices may continue this movement by exceeding the upper band, or in a downtrend, prices may exceed the lower band and continue this movement for a while,
- Closures outside the band do not indicate a reversal,
- The moving average value used in the bands is 20 bars. However, it can be used by changing this value in different markets and instruments,
Bollinger Band + Indicators
Since Bollinger bands cannot produce buy-sell signals on their own, they should be used by utilizing various indicators. Mr. Bollinger also emphasizes that bands work more harmoniously and successfully with volume and momentum indicators.
In addition, Mr. Bollinger has listed the auxiliary indicators that can be used in his book where he explains the bands as follows;
- Intraday Intensity Index (II)
- Accumulation Distribution (A/D)
- Money Flow Index (MFI)
- Volume Weighted MACD (VWMACD)
- On Balance Volume (OBV)
- Volume Price Trend (VPT)
- Negative and Positive Volume Indices
Watch our video for detailed explanation!