Blog
What is MFI Indicator? Be the first to hear market sounds!
In this article, we will be talking about the MFI indicator which stands for Monet Flow Index generally, but we also included its history, developer, formula, and how it is used in detail.
The MFI indicator was developed by the technical analysts Gene Quong and Avrum Soudack. Analysts have created this indicator to calculate the strength of money flowing into securities such as stocks, commodities, and exchange parity. This is where it gets its name from.
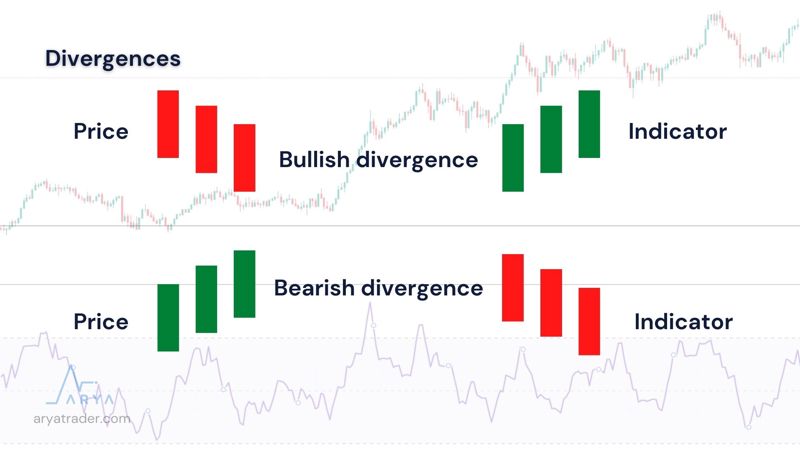
MFI, just like RSI, leads the price movements however it is different from RSI in the sense that MFI draws conclusions both using volume and price together. In most general definition, it is used to determine overbought and oversold signals of a financial asset. It is also useful to detect divergencies regarding the change in the price of the traded financial asset.
MFI Formula
Like most indicators, MFI has a very complex formula of calculation. Of course, you do not need to make this calculation since most of the brokerage platforms make this calculation automatically. However, this formula will be added to give you a general idea of it.
- Typical Price Calculation: Typical Price= (High+Low+Close)/2
- Raw Money Flow Calculation: Raw Money Flow= Typical Price*Volume
- Money Flow Rate Calculation: Money Flow Rate= 14 periods positive money flow/14 periods negative money flow
- Money Flow Index Calculation: Money Flow Index=100–100/1 + Money Flow Rate
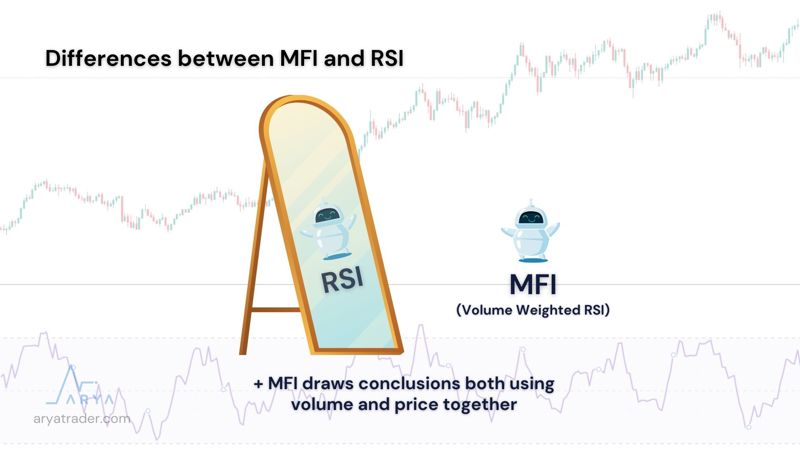
Differences between MFI and RSI
As it was stated before, MFI and RSI are very similar to each other in terms of both operation and appearance. However, there are also critical differences. While RSI contains price data; The MFI includes both price and volume data. In this respect, it is also called Volume Weighted RSI.
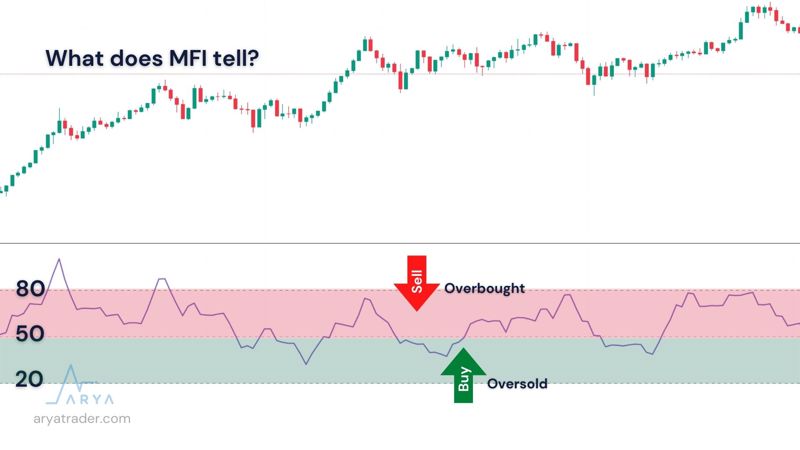
What does MFI tell?
When you select the MFI indicator, it automatically appears with optimized settings. The view it creates has a 20 band as the Oversold line, an 80 band as the overbought zone, and a 50 as the Midline in the middle.
It can still be risky to trade with the MFI, which produces values in the range between 0 and 100, by looking at the trading zones. Because in the period of very strong trends, these threshold lines can be broken and give misleading results. In order to refine the error signals, stability in price movements should be examined, or help from additional indicators should be sought.
MFI + Indicators
It is extremely important to get help from additional indicators against false signals that MFI will give, just like other indicators, to protect your investments. Among the auxiliary indicators to be used include:
- RSI
- Stochastic RSI
- CMF
- MACD
- ATR
- CCI
MFI Divergences
Watch our video for detailed explanation!