Blog
What is the ATR? The best indicator to measure market volatility!
ATR is an indicator consisting of the initials of the words Average True Range. In this indicator, it is seen how much a financial asset moves in a certain time period. In short, it is an indicator of volatility. It is the most widely used volatility measurement tool in technical analysis calculations.
ATR, was developed in 1978 by J. Welles Wilder. Jr. Welles Wilder was an American mechanical engineer born in 1935, he first dealt with the real estate market and then the financial markets. He has covered numerous technical analysis articles and books.
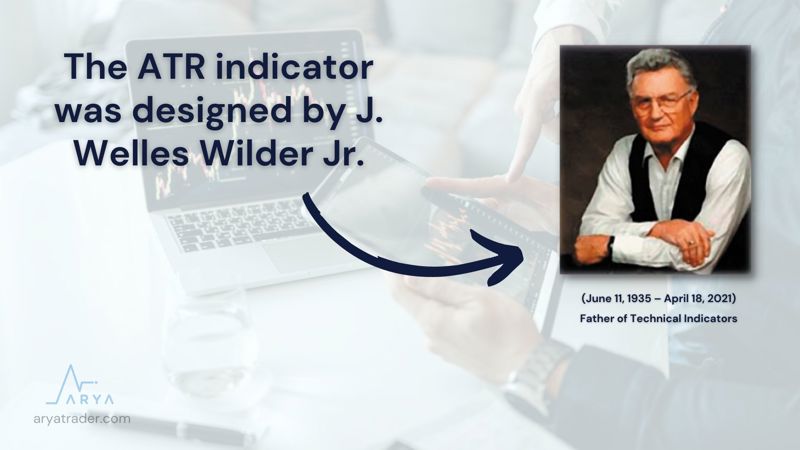
Wilder has also developed many analysis methods such as ATR (Average True Range), RSI (Relative Strength Index), ADX (Average Directional Index) and Parabolic Sar.
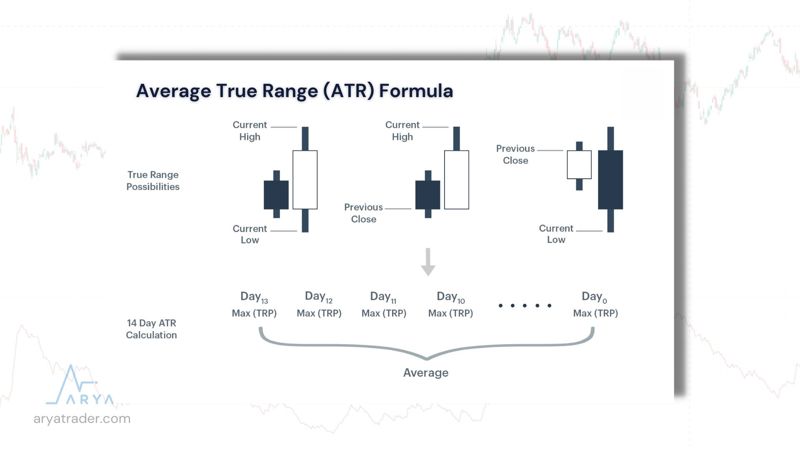
Average True Range (ATR) Formula
If we examine how the Average True Range is calculated; It has been formulated taking into account the most recent high and low ranges and, if necessary, previous closes. The Average True Range is also found with the EMA of the calculated real range. The formula is as in the image.
Since the ATR is an indicator that measures the volatility caused by price gaps and limit movements, it cannot determine the direction of the price. However, it is one of the auxiliary tools that most clearly determines market volatility. Although it was originally developed for commodity markets, it is actively used in Forex and even Cryptocurrency markets.
In the most common usage, it is seen that the examination is done in a 14-day period. You can use ATR during the day, daily, weekly or even monthly. However, in general, the use of 14 days is preferred.
So, what does the ATR show us? To answer this question, in the simplest definition, an asset with high price movement has a high ATR, while an asset with low price movement has a low ATR. In other words, the volatility of the price is taken as a basis, not whether it is up or down.
However, although rarely, some investors also detect buy-sell signals with ATR. There is a prediction that there will be a change in volatility as the price of a financial asset values more than the ATR at the last close. However, it is important to get the help of more than one indicator, as it will not be enough to get a buy-sell signal alone.
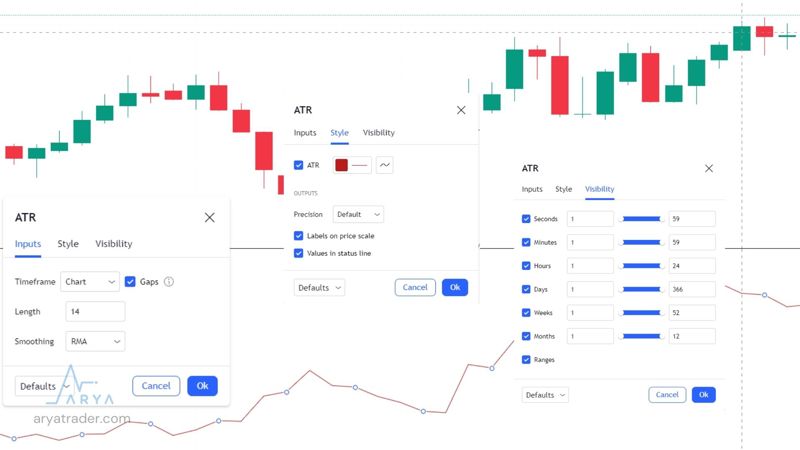
When you select ATR from the indicators option on the platform you are using, the calculation will automatically appear. Let’s take a closer look at the indicator that comes as a single line after selecting it…
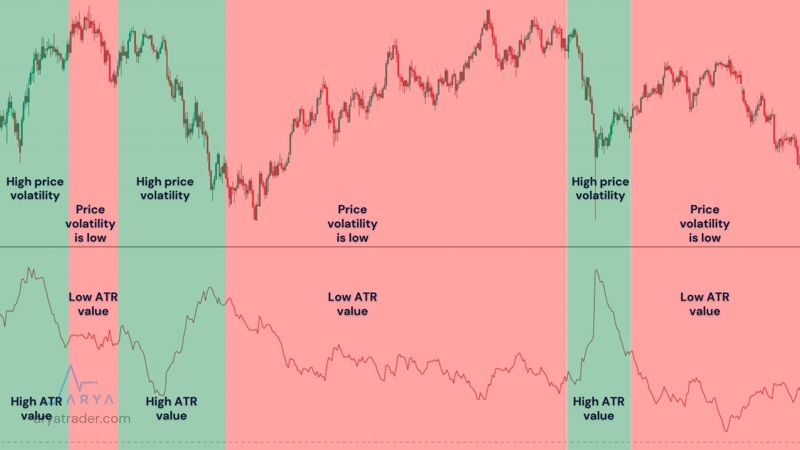
This line runs parallel to the price. As seen on the screen, the narrower the band in the price range, the flatter the ATR is. The more the price volatility has increased, the more the ATR rises whether it falls or rises.
Many new traders can trade hourly, daily or weekly, etc. This frightens them as they cannot analyze changes transparently. In fact, these changes are easily detected thanks to the Average True Range indicator. Since the volatility during that day is included in the indicator, it is also an important opportunity for daily investment.
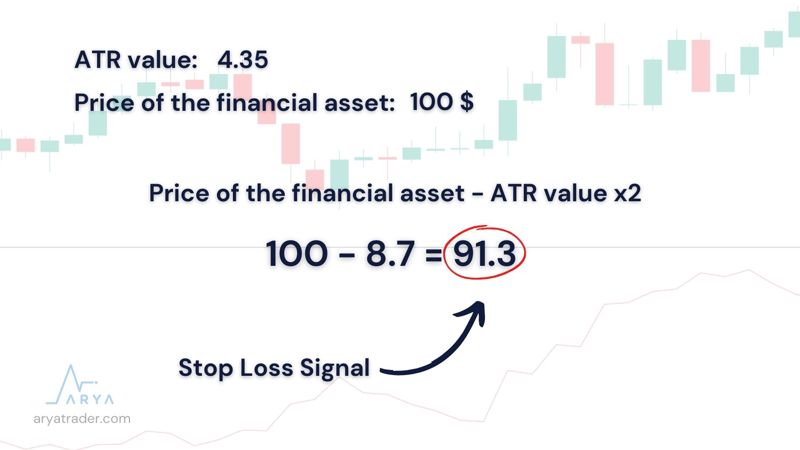
Now let’s come to ATR’s main contribution. Using the ATR indicator correctly when entering the trade will help you to detect where Stop Loss, Take Profit should be or how big your position should be. Now, let’s understand this through an example;
Consider a financial asset with a 14 candle ATR of 4.35 and its price is $100. The value of 8.7, which is 2 times the ATR value, is subtracted from 100 from the price. The result obtained is 91.3. In other words, if the price of the financial asset falls below 91.3, it means that it is not right to stay in this asset. So it should be seen as a signal for Stop Loss.
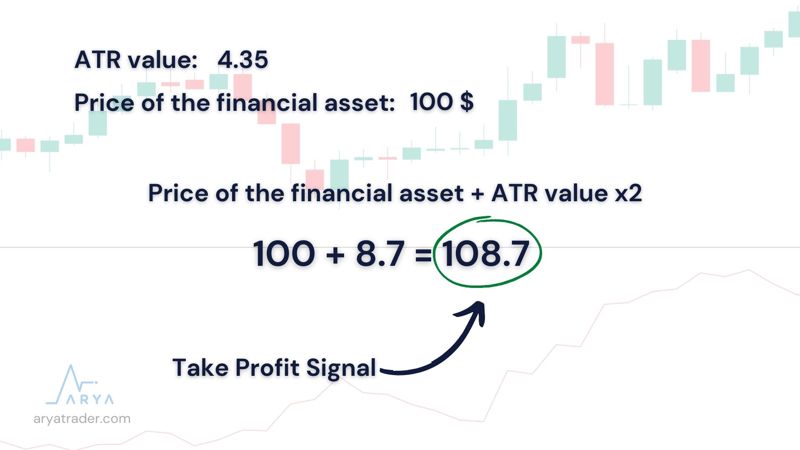
If we calculate Take Profit with the same method, let’s add 8.7, which is twice the ATR value, on top of the $100 financial asset. We determined the result as 108.7 dollars. So the natural flow of the financial asset up to level 108.7 is a logical Take Profit point.
In general, thanks to the ATR indicator;
- Market volatility is seen,
- Measures motion volatility, not direction
- Used to predict market returns,
- Used for Stop Loss and Take Profit detection,
- It is a subjective and open to interpretation indicator,
- Additional indicator should be used instead of trading alone.
Watch our video for detailed explanation!