Blog
What is the Stochastic indicator? How is it interpreted?
The Stochastic indicator is calculated to predict the future prices of the investment asset. It creates a logical statistic by examining the past price movements of an investment asset. Since its inception, it has been among the analysis methods frequently preferred by investors in various investment markets.

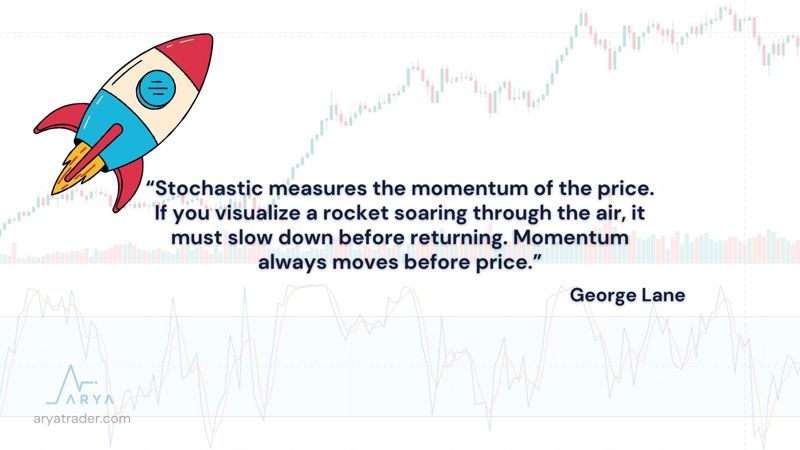
The stochastic indicator was first developed by George Lane in the late 1950s. When developing this indicator, Mr. Lane calculated it to determine the momentum or velocity of the price, not to track volume and price.
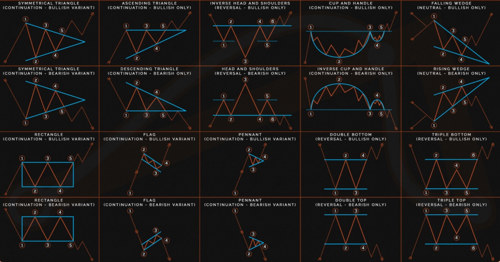
The Stochastic indicator is a useful analysis method for tracking trend reversals. With this indicator, investors can examine price-indicator mismatches. It easily generates signals for bull or bear market returns. It is also possible to detect overbought and oversold levels thanks to Stochastic.
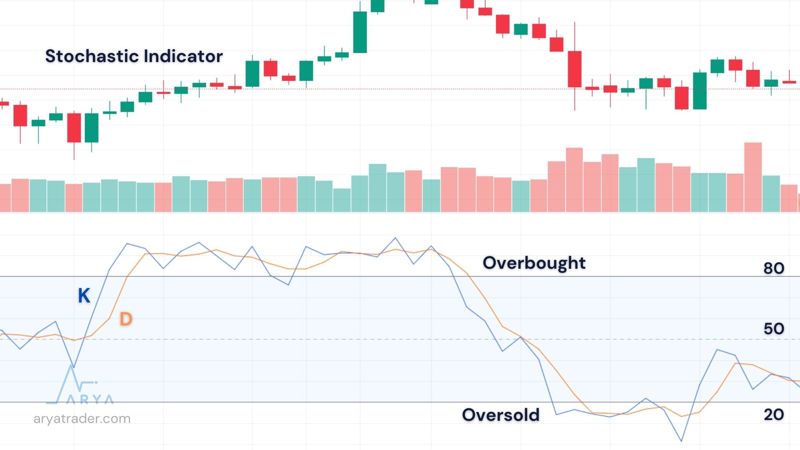
There are two separate lines on the Stochastic value indicator. These are defined as %K and %D. The lower region shows a range of 0 to 20 with two value lines; The upper region shows a range of 80 to 100 is located. These zones form signal centers that indicate oversold or overbought zones.
Stochastic Indicator Formula
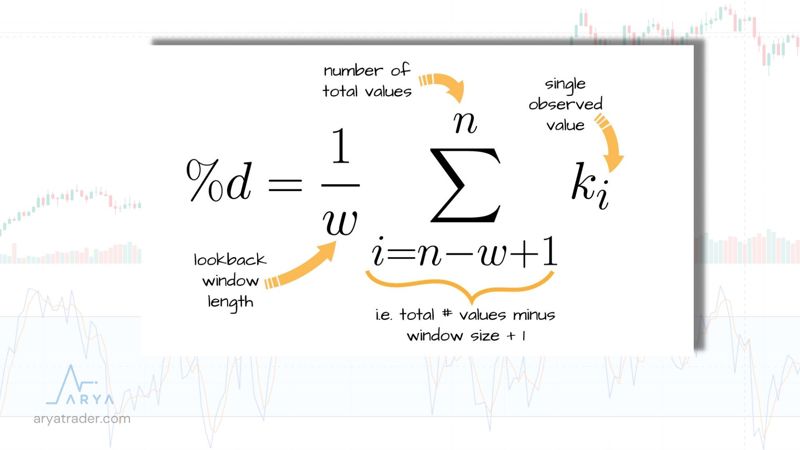
So, what do %K and %D mean and how are they calculated?
First, the formula of %K was calculated as in the image.
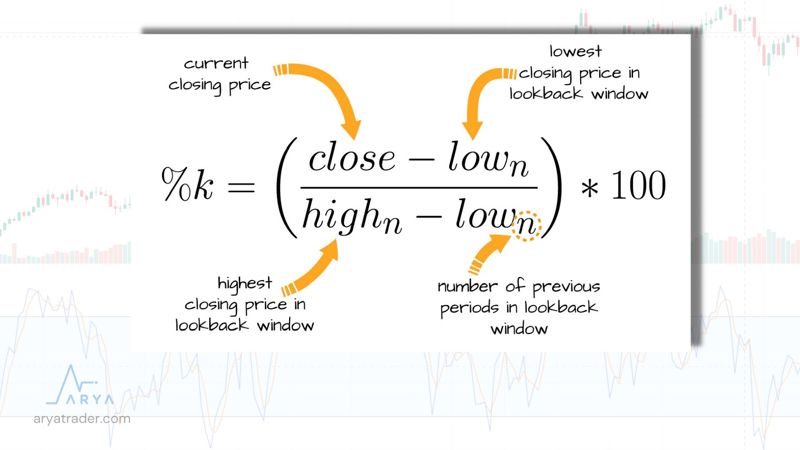
In this formula, analysis is made by calculating the last 14 days’ input.
The %D formula is calculated with the 3-period moving average (SMA) of %K as seen in the image.
Of course, I present these formulas to you to form an idea about the method of analysis. Because you do not need to make any calculations while using this indicator. The indicator performs all the operations by itself and presents the result to you graphically.
Stochastic Indicator Strategy
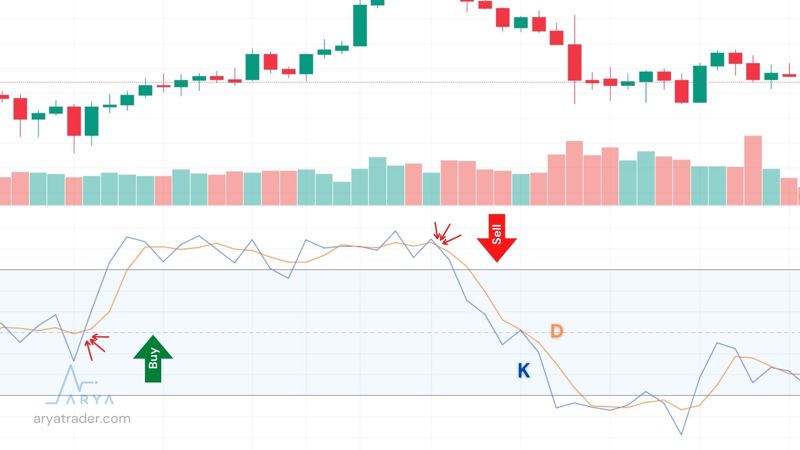
The most important sign in the Stochastic indicator occurs when the K and D lines cross each other up or down. K line crosses D line downwards Sell Signal; It also gives a Buy Signal when the K line crosses the D line upwards.
In addition, according to the analysis results obtained by applying to hundreds of samples, the Stochastic indicator;
1 — Buy-Sell signals close to overbought and oversold zones are stronger.
2 — Buy-Sell signals in the normal region are weaker.
3 — In cases where the trend is very strong, these signals and the condition of the regions may not give the expected results.
However, it should not be forgotten that the value of the investment asset may create results contrary to these expectations thanks to the economic-political effects.
Another important issue is due to incompatibilities. These differences arise due to the difference between the price and the oscillator. At the same time, these mismatches signal potential turning points. Because momentum does not confirm the price. These inconsistencies appear in two forms.
1 — Bullish Divergence: It occurs when the price of the traded financial asset decreases, while the indicator moves in the opposite direction. While the bottom levels of the indicator are getting higher and higher, the bottom levels of the price are also decreasing. This stands for Buy Signal and indicates that prices will rise.
2 — Bearish Divergence: While the price of the traded financial asset rises, the indicator lines show an opposite trend. While the peak levels shown by the indicator are decreasing, the peak levels shown by the price are increasing. This means a Sell Signal and means that prices will fall.
However, it should be noted that inconsistencies or oversold zones are not sufficient on their own. For this, using more than one indicator, following the trend lines, and following the current news about the investment, the asset will also protect your investments.
Watch our video for detailed explanation!