Blog
What is the CCI indicator? And how to use CCI?
This oscillator, called as the Commodity Channel Index (CCI), is currently a method of analysis that maintains its popularity. The CCI indicator was first published in Commodities magazine in 1980 by analyst Donald Lambert. Since then, it has continued to be used by showing its effectiveness in commodities and all other markets.

The main objective of this indicator is to determine overbuying and selling levels. But it was also used to reverse and determine the detection. The first goal is to determine the tendencies of investment assets, but today there is a very broad range of use.
From Forex markets to the world of digital money, it is used together with indicators in a wide range of investment markets, either single or binary.
The CCI structure is more likely to detect short-term trend changes. This oscillator also gives significant signals to detect over-buying and over-selling regions, resulting in more successful horizontal markets.
It also communicates a message that the prices will revert with signals from over-buying and over-selling points. And with this oscillator, you can easily predict trend changes.
However, it should be noted that if the CCI value is going successively in the oversold zone, this warns you not to purchase, but to sell. Because it reflects that markets depend on the sales trend in a display that follows this way.
How does CCI work?
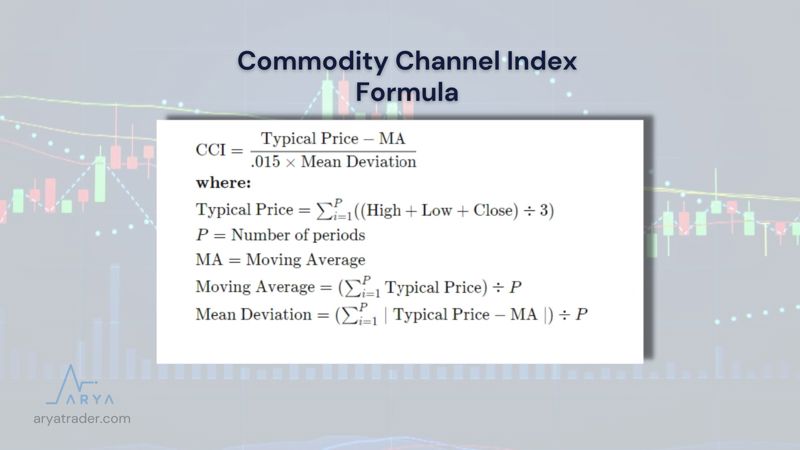
CCI oscillator developed by analyst D. Lambert. It is a technical indicator that measures the difference between the current price and the historical average price. When the CCI is above zero, the price is above the historical average. Conversely, when the CCI value is below zero, the price date is below the average.
The Commodity Channel Index (CCI) formula is as in the image.
So, How to Use CCI?
When using CCI analysis, you can also develop your own analysis method by specifying the period range in the Inputs section. The generally accepted use of CCI is 20 periods. In this selection, a value emerges by calculating the 20-period high and low closings and the typical price.
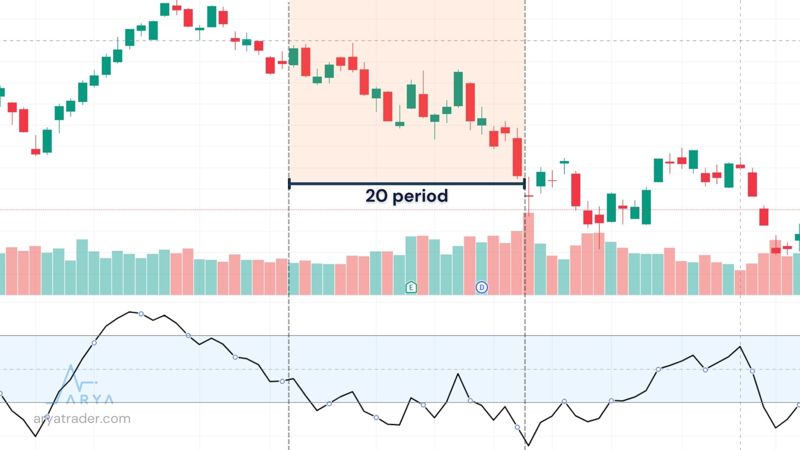
This emerging value also offers you a clue to detect new trends. Another point to be considered in this oscillator, which produces positive and negative values, is to produce values between 200 and -200 depending on the type of financial asset traded.
CCI Disputes
As with the momentum-based oscillators, the difference between the price and the indicator should be well studied for CCI. The divergences between the CCI value and the price action also reflect changes in the trend.
In the Bullish Divergence, which is the first type of divergence, if the first bottom is lower than the second bottom, it is predicted that prices may also decrease.
In the Bearish Divergence, on the other hand, the opinion is that while the peak of the CCI values will decrease, the prices will increase as well.
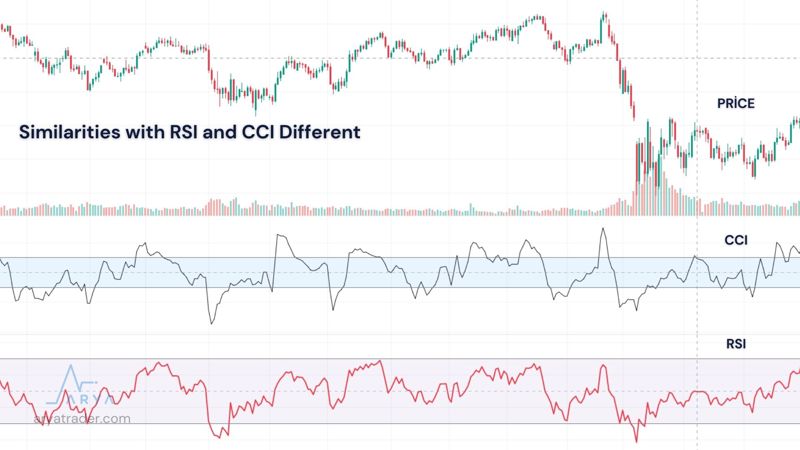
Similarities with RSI and CCI Different
Unlike RSI, it works between -100 and +100. Again, unlike the RSI, it overflowed the channel and gave more distinct signals in buying and selling. Although the RSI and CCI indicators progressed by drawing a very similar line at the first stage, it was seen in a detailed observation that there were critical differences between the two. While CCI signals at lower and higher levels than the RSI, it also provides the investor with the opportunity to trade quickly or open a trade early.
Using CCI and Stochastic Oscillator
Another analysis tool used with CCI is the Stochastic oscillator. While the Stochastic oscillator is limited to a range of values between 0 and 100, the CCI values are in an unlimited range. They will also give different signals in overbought or oversold due to differences in the way they are calculated. As in the RSI example, using Stochastic in comparison with CCI will allow you to make more accurate investment decisions.
Watch our video for detailed explanation!