Blog
What is the MACD indicator? The most common analysis method!
In our previous article tutorial, we talked about the history, usage, and details of the RSI oscillator. Now we will consider another most preferred indicator. The subject of this article is what is the MACD indicator, we will examine its usage and details together.
The MACD indicator is often preferred in investment transactions due to the positive results it gives from trading. It takes its name from the initials of the words Moving Average Convergence Divergence. This indicator continues to be used in other investment vehicles, especially in the Forex Market, while maintaining its uptime.
The MACD indicator was developed by Gerald Appel in 1979. Since then, it has been one of the most important tools of technical analysis. Moving averages form the basis of this analysis method. It is an indicator that follows the trends as it centers on moving averages as it is developed. The most general explanation of this indicator consists of the difference between the short-term and long-term exponential averages.

Two different lengths of moving average values are used to calculate the leading trend direction and duration of this indicator. While 26 observations are taken as the basis for the long term, the exponential moving average (EMA) value with 12 observations is taken as the basis for the short term. This calculation was determined as a formula as follows in the image:
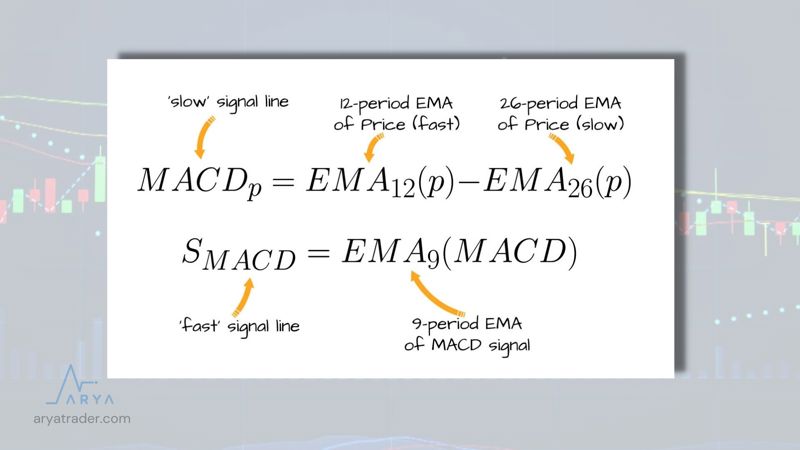 MACD Line: (12-day EMA — 26-day EMA) Signal Line: 9-day EMA of MACD Line MACD Histogram: MACD Line — Signal Line
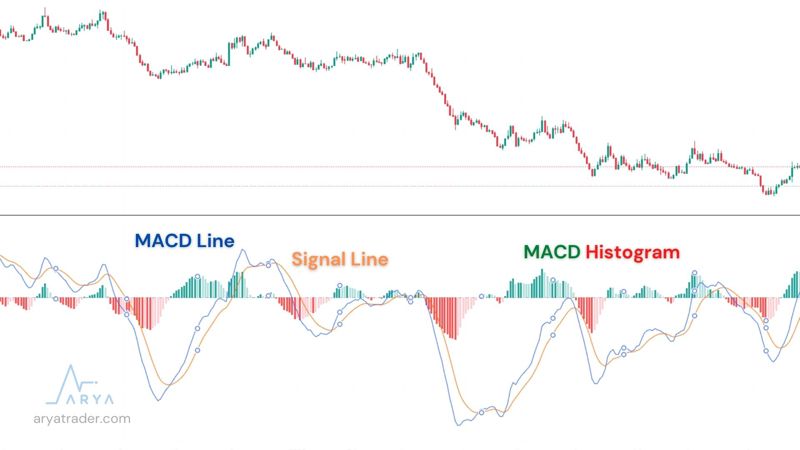 As a result of this indicator calculation, a view consisting of three separate components appears on the graph. These form three different value lines on the chart in the form of MACD Line, Signal Line and MACD Histogram. The third value indicator, the Histogram, was developed by Thomas Aspray in 1986 and is one of the components in today’s indicator plugins.

While interpreting the MACD Indicator, these three value components are used, and the positioning of these values is also necessary for inference. There are three different methods of interpreting these indicators.
How does a MACD indicator work?
1. Intersection Points: First of all, when considering the intersections, attention is paid to the movement of the MACD indicator and the Signal line. If the MACD indicator falls below the Signal line, it means a bearish signal and indicates that a sell action has arrived. Or, on the contrary, if the MACD indicator rises above the signal line, it indicates that there is an upward movement and it is time to buy. However, for the right result, it is always preferred by investors to trade below or above the intersection point.
2. Divergence Situations: If the value of the investment product diverges from the MACD indicator, it means that the current trend is over.
3. Abnormal Extreme Increase: In the event that the MACD indicator overrises, it shows that the short-term moving average pushes the long-term average upwards. This indicates that the financial asset to be traded is in the overbought region and will soon return to normal. However, determining the bottom and top of the zero line as a signal is an issue that many investors focus on. While the MACD indicator is below zero, the short-term average is above the long-term average, indicating that the upward movement will continue. When it is below zero, on the contrary, it shows the downward movement of the movement.
If we transfer the interpretation of the value lines on the graph; If the last 12-day average close is higher than the 26-day average close, the price is also up. Although the 12-day average close is lower than the 26-day average close, the price is also on the downside. Although these two averages are equal to each other, the MACD is in the zero region and the price can be interpreted as remaining horizontal in this case.
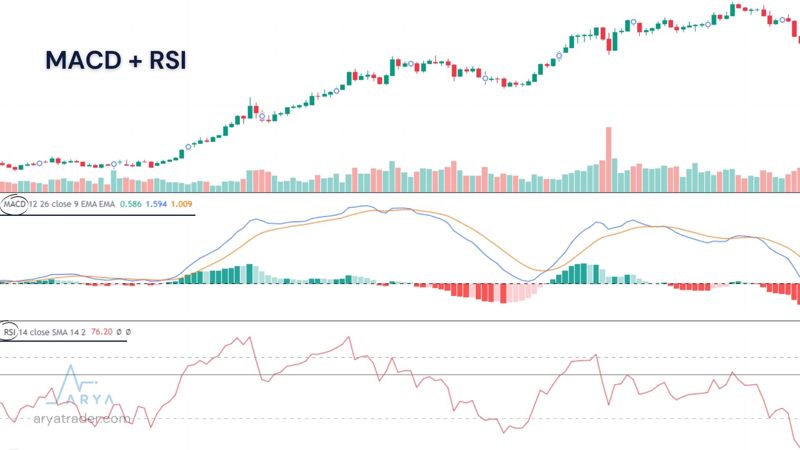
Which is better MACD or RSI?
However, it should be noted that there are no overbought or oversold zones in the MACD indicator, as in the RSI example. The convergence in MACD indicators can be taken as a basis for detecting and confirming these regions. While the decrease in the difference shows the overbought-sold region, it gives the possibility that the purchase-sell transaction will take place, on the contrary, with the moment of intersection. For this reason, analysis with an indicator such as RSI to determine the future of prices will yield healthier results.
The feature that makes the MACD indicator different from the others is that it acts like two indicators. Due to this feature, it can be used both when determining trends and measuring momentums. For this reason, analysis is performed without the need for many different indicators.
The disadvantages of MACD are that it can produce false positive predictions. In some cases, it cannot predict a return and determine the true price return. In this case, traders stay away from short-term trades in order to get rid of false signals instead of trading quickly with MACD signals. In addition, the timing error is tried to be prevented by changing the calculation parameters of the MACD.
Watch our video for detailed explanation!