Blog
What is the RSI indicator, and how can you use this most profitable analysis method?
In this article, our subject has been to explain the purpose and usage of the indicator named RSI, starting from its history. You can manage your investments correctly by learning to use the RSI indicator. So, let’s take a closer look at the RSI, which is among the most frequently used and most accurate indicators…
Indicators are statistics produced using different techniques to calculate trends in financial markets. All investment markets, including the Forex, stock, and crypto monetary markets, benefit from these indicators. Thanks to these indicators, investors analyze market trends and shape their investment strategies.
These indicators have been developed to predict future price directions by examining past price movements of trading assets in markets. Although there are dozens of indicators, some of them have been tested several times and become authoritative.
In addition to using one indicator for analysis, investors can also use more than one indicator in order to reach a healthier analysis. However, using too many indicators at the same time can also produce incorrect results. Determining which indicator to use in which situation is about improving your financial literacy. In this way, determining the buy-sell points with high statistical realization allows you to invest correctly.
The RSI indicator was designed by J. Welles Wilder Jr. Wilder was an American mechanical engineer born in 1935 who first dealt with the real estate market and then the financial markets. He calls the Relative Strength Index the RSI indicator among the most well-known technical analysis inventions. In addition, Wilder is the inventor of other important analysis methods called Average True Range (ATR), Average Directional Index (ADX), and Parabolic SAR.
RSI, which is among the most famous analysis methods, is a versatile and momentum-based oscillator. In its most general definition, it produces buy-sell signals for the investor by looking at the buy-sell signals.
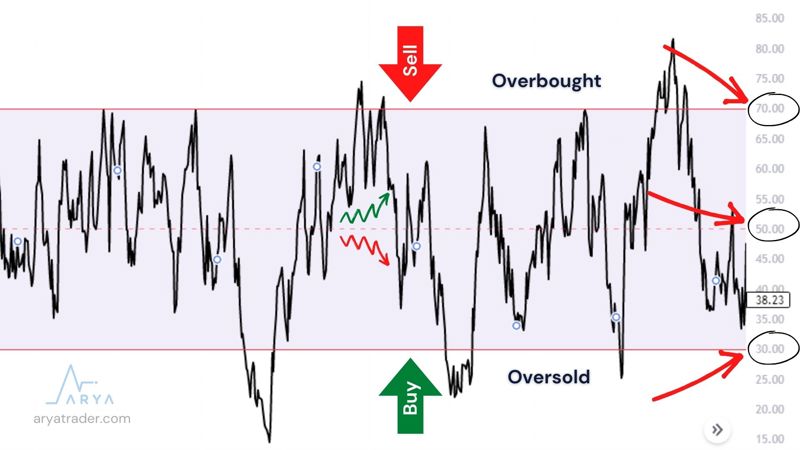
The RSI calculation gives a buy-sell signal by looking at the value range between 0–100. It determines the base and top points of these signal points to buy when they are 30 or below 30 and to sell when they are 70 and above 70.
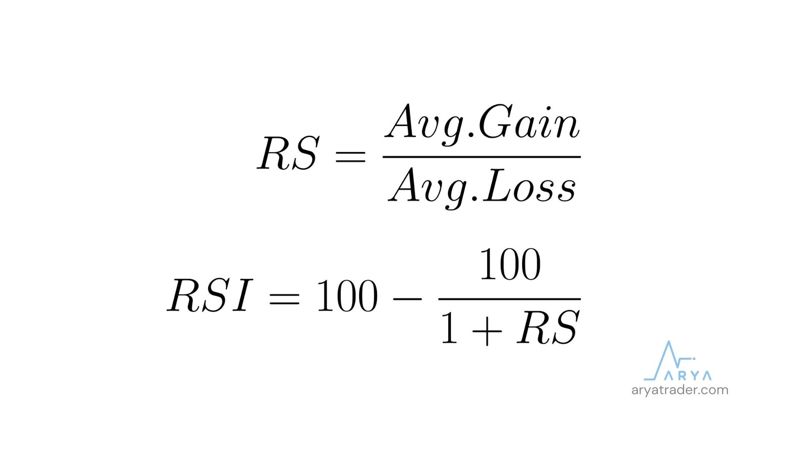
The RSI formula is stated as in the following image:
In addition, the analysis format can be changed by changing the period interval of this process. For example, instead of calculating 14 periods backward, the investor can write his own length into the input and create a new strategy.
According to the results of the analysis, the RSI indicator is a sell signal because the range above 70 is an overbought region, and the range below 30 is a buy signal because it is an oversold region. Because the simple logic principle of this calculation is that the trading trends in these range regions are at abnormal levels and will start to end soon. However, above and below the middle line of the RSI at 50 is also helpful in identifying a trend change.
At a value that breaks the 50 levels, the analysis tells us that there is a rise towards 70. On the contrary, the value below the 50 levels is an indication that the trend is down. This average level can also be used as a trend tracking line.
Another issue we’re going to focus on is what is the RSI divergence.
RSI divergence occurs when there is a difference between the price and the RSI value. In general, two different forms of conflict can be mentioned. These are Bullish Divergence and Bearish Divergence.
The first type of dispute occurred when the financial asset traded fell, and the RSI scores moved in the opposite direction. These signals indicate that the prices will rise and the purchase should be made.
The other form of dispute is the Bearish Divergence. This is where the price of the financial assets being processed is increased, and the RSI scores are reversed. The peak levels shown by the indicator show a drop, while the peak levels of the price value show a rise in the opposite way.
Wilder’s student, Andrew Cardwell, has brought a different interpretation to these disputes:
1. Bullish divergences only occur in a bear trend,
2. Bearish divergences only occur in a bull trend,
3. Usually, it only causes a short correction in both divergences, not a trend reversal.
In a summary of Cardwell’s comments, disputes should be used as trend confirmation, and no definitive return should be expected.
According to Cardwell, in Positive Divergence, the price makes a higher bottom, while the RSI makes a lower bottom. It happens in a bull market and is seen at the 30–50 levels.
Negative Divergence, on the other hand, makes the price a lower high and the RSI a higher high. It happens in a bear market and is seen at the 50–70 levels.
In summary, with the RSI indicator:
1. Peak and bottom Points
2. Formations
3. Trend Reversals
4. Support and resistance Points and
5. Divergencies
can be examined.
In addition, investors should be aware of RSI in those points listed:
1. RSI is known to give more accurate results for short and medium-term trading.
2. However, using the RSI indicator alone is insufficient for long-term investments.
3. Since the RSI indicator is a momentum-focused analysis method, you should not rely on a single analysis method such as RSI in your investment transactions.
4. These values do not have to be stuck in every investment instrument’s 30–70 band range; dozens of trading assets show the opposite.
5. In economic-political extraordinary situations in countries, situations that show the opposite of all indicators, including RSI, may occur.
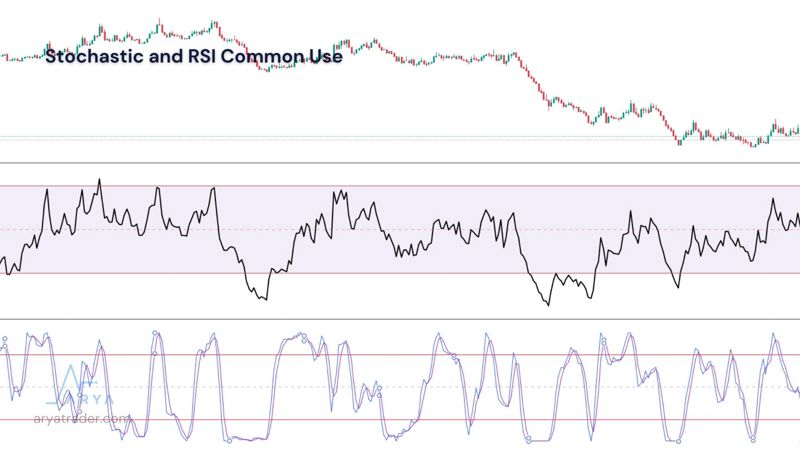
One of the last things we will mention about RSI is this indicator’s popular binary use cases. The most common uses are:
Stochastic and RSI Common Use
StochRSI is a popular analysis tool developed on the basis of the RSI indicator. It is obtained by subtracting the RSI data from the StochRSI data. The most important difference is that the StochRSI moves from overbought to oversold very quickly, while the RSI moves slowly.
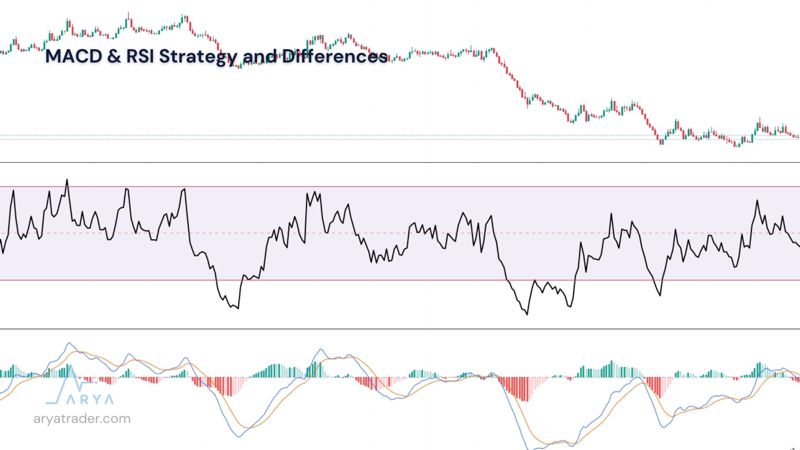
MACD & RSI Strategy and Differences
Moving Average Convergence Divergence, with the MACD indicator fully expanded, compares two exponential moving averages (EMAs), while the RSI measures the percentage of the price on the ups and downs. However, when the two are combined, they are two very common indicators to use together, as much better signal analysis is obtained.
Watch our video for detailed explanation!